Preface
The "TOS and Thinkscript Snippet Collection" by Stanl has been a great help in my thinkscript development journey. I constantly look to this work for ideas and techniques.
It appears that "TOS and Thinkscript Snippet Collection" hasn’t been update in 3 years as of this writing, … I am not sure if something happened to StanL or what.
My Motivations: I found the pdf hard to read at times and I want the great work StanL did to live on. So I converted the PDF to Asciidoctor html format. TOS-and-Thinkscript-Snippet-Collection.
As converting from PDF is a lot of work, … This is a work in process and I will continue to work on the formatting and clean up.
Please feel free to fork and send me pull requests or corrections and additions.
Credits: StanL http://mytrade.com/StanL
TEST - Jim Shingler
  1
2
3
4
5
6
7
8
9
10
11
12
13
14
15
16
17
18
19
20
21

  file1.eachLine { line ->
    //println ">${line}<"
    if (line.startsWith("- ") && !line.startsWith("- NEXT")) {
        l1 = line.replace("- ","")
        l2 = line.toUpperCase().split(/\./)[0].trim()
        //println "l2>${l2.split(/\-/).size()} <l2"
        if (l2.split(/\-/).size() > 2) {
            l3 = l2.split(/\-/)[2]
                .replaceAll(" ","_")
                .replaceAll("'","")
                .replaceAll(",","")
                .replaceAll("\\(","")
                .replaceAll("\\)","")
                .replaceAll("&","AND")
            println "- [${l1}](#$l3)"
            println "<a name=\"${l3}\"> </a>"
        }
    } else {
        println line
    }
}
Introduction
Snippet
A 'snippet' is a small piece(s) of script, oriented towards accomplishing a specific function identified by the snippet’s title:Sort of a building block. This PDF takes the liberty to include TOS-platform-features that are not only script snippets but may be any TOS features worth knowing. Perhaps this document can, more appropriately, be call an 'Almanac'.
The emphasis herein is for learning TOS and ThinkScript from the ground up. Numerous examples are used as a learning tool ranging from simple/basic to complex. The PDF format was selected, with extra features, like the hyperlinked Table-of-Contents, to make subjects easily found. This document also proovides a reference for future coding activities.
Hence being familar with what is available herein, will enhance recall when needed. A good PDF reader with search capability is also recommended.
Legend
Click the underlined Page ? to go to that page When there, you can return to to the TOC by clicking Return to TOC.
Titles appearing in the Table Of Contents above are the same and colored blue throughout this document
Revised: 07/25/14
Organization:
The first letter indicates the category of the subject.
B- = Basic platform or coding subjects, fundamental principles, fundamental examples and how-to-do’s
S- = Scan
C- = Coding of studies, strategies, snippets, et al that accomplish a purpose/result
T- = A Tip or Trick on how you might use TOS or TS to accomplish a specific useful purpose
?- = In the subject’s heading, ? means that the data is variable 'inputted' data defined by the user
C&S- = On occasion, a item may also have multiple codes defining what is included inside. For example, this symbol indicates when scan code is included.
Acknowledgements
The people on the ThinkScript Lounge and Yahoo TOS_ThinkScript generously contribute much time and effort helping those learning and using ThinkOrSwim and ThinkScript. Many items herein originated on the those chatroom postings.
Much credit and thanks are due those people. We are all grateful to them for their selfless contributions.
Usage
Although a subject may not be of interest to you, the coding techniques involved may be pertinent to what you desire to code, either today or at some time in the future. It is useful to be aware of the techniques so that, when the time comes, you will know where to look to get the how-to-do specifics.
Hope you find this document useful. Any suggestion for improvement or inclusion are welcome.
Acronyms used herein
TOS |
ThinkOrSwim |
TS |
ThinkScript |
WLC |
An abbreviation for "WatchList Column" |
TOC |
'Table Of Contents' in this document |
Portable Document Format = the type of file format of this document. Readers of PDF files are readily available. See REFERENCES for a reader source. |
|
SD |
Standard Deviation |
Use of '…' and "…" Often the single and double quotes are used to identify precise coding, words or statements whose use is not intended to include the quote marks themselves. At times coloring may also be used to do the same.
'Pre-defined' and 'built-in' are synonymous when referring to studies that are provided by TOS within the program. The coding of these may be copied and reused in your own studies but built-ins cannot be changed.
Suggestion for Ease-of-Use
As this Snippet Collection grows, finding what you want becomes more difficult. It is recommended that you use a good PDF reader that has good navigation and search/find capabilities. There are many readers available but the recommended one is listed in the References at the end of this document.
If you want to find something, enter what you want into the 'find' tool of the PDF reader and it will navigate you to the possible matches. Try different 'find' entries if you are not successful. Subjects are often named differently. The most expeditious search is looking over the TOC or using 'find' in the TOC as opposed to using 'find' throughout the body of the document.
Basic Coding and Platform Principles
Add Info Bubbles To a Study or a Study’s Inputs
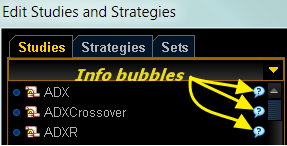
As shown above the study list and the inputs have info bubbles. You may add these info bubbles to your studies.
To make an 'Info Bubble' for a study and strategy:
-
Above the code lines, place
#hint: ????????where ???????? is the description you want displayed when the bubble is clicked. -
The tags listed under 'TAGS and their PURPOSE:' may be used to format the ????????.
-
An example is --→
#hint: Plots a <b>trend line</b> between the two input dates.
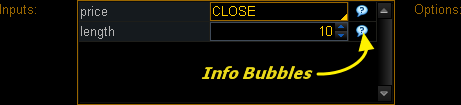
To make an 'Info Bubble' for 'Edit Studies' input
-
Immediately after the semi-colon on the input’s line (preferred location), place
#hint <the input variable name>: (the desired text you want displayed when the bubble is clicked). -
The tags listed under 'TAGS and their PURPOSE:' may be used to format the desired text.
-
An example is --→
input Length = 10 #hint Length: The number of bars used to calculate the average. -
Notice that the colon is placed after the input variable name (in this case Length).
Formatting is possible using HTML tags. Some of the common tags you may be interested in are listed below:
TAGS and their PURPOSE:
<b> ......... </b>     Makes the text between the tags bold.

\n                       Starts a new line

<li>........... </li>      Creates indented lists
Example of the following script and its result:
#hint: <b>Bar Count Between Highs</b>\n Counts the number of bars between each high in the specified length.
IF EXPRESSIONS AND STATEMENTS EXPLAINED
There are three forms of if statements. The 'immediate-if' is the shortest and is documented at
-
http://demo.thinkorswim.com:7001/manual/metal/thinkscript/reference/Functions/Others/If.html . The other two are
-
the 'if-expression' and the 'if-statement', both of which are documented at
-
http://demo.thinkorswim.com:7001/manual/metal/thinkscript/reference/Reserved%20Words/if.html . The thinkscript documentation infers that there are more forms of the if-then-else, but the additional examples are merely the base form shown with nested if-then-else statements/expressions.
The 'immediate-if' explained
The syntax is: If(double condition, double true value, double false value); This is the simplest and easiest to use. An example is: Plot Maximum1 = If(close > open, close, open); This reads as “If the close is greater than the open, then plot the close. Otherwise/else, if the close is not greater than the open, then plot the open.” This form is very useful as the right-hand side of the equal sign in a Plot or Def statement. Also this form can be used with else to create more complex conditions. This form is a function and returns a type of double that is very useful for the if-then-else statements/expressions when you are processing numbers and nesting.
The word 'double' is often vague in its meaning in ThinkScript but it means a floating-decimal-point-number of double precision in programming terminology. Any further meaning-clarification is unnecessary here. The impact of 'double' is that constants such as the names of the 23 ThinkScript colors, like LIGHT_RED, BLUE, UPTICK, etc., are not floating point numbers and hence cannot be used in this immediate-if. In this case, the if-expression would be used.
The 'if-expression' explained
The syntax is: if close > open then close else open; An example is: plot Maximum2 = if close > open then close else open; An IF….THEN….ELSE are all required. A nesting (putting if’s within if’s) example, in the recommended layout for easy reading, is:
plot Maximum2 = if close > open
  then close
  else if close = open
  then (low + high)/2
  else open;
Note that the last 'else open' relates to the 'if close > open' and applies when the intermediate 'else-if close = open' is not true. This nested-if reads as: If close is greater than the open then plot the close. If the close equals the open then plot the (low + high)/2 . If the close is not greater than the open and the close does not equal the open, then plot the open.
The if-expression will have only one semi-colon that will terminate the entire expression, regardless of the complexity.
The 'if-statement' explained
The syntax and example is:
plot Maximum3;

if close > open [then]{
  Maximum3 = close;
} else {
  Maximum3 = open;
}
The '[then]' above means that it is optional but it is recommended that it always be used for clarity. Notice that each statement is enclosed within a block (the parts enclosed in the { } ) and must end with a semi-colon.
Comparison of all three 'if' syntaxs
plot Maximum1 = If(close > open, close, open); # This is the immediate-if syntax

plot Maximum2 = if close > open then close else open; # This is an if-expression

plot Maximum3; # This and the lines below make up an if-statement
if close > open {
  Maximum3 = close;
} else {
  Maximum3 = open;
}
Excellent examples of the power of if..then..else can be seen in these documents herein:
ADD AN INDEX OR FUTURE LOWER CHART and SLOPE OF AN AVERAGE
CHANGE THE COLORING OF A PLOT BASED ON A CONDITION
A very favorite feature is to change the color of a plot based on a condition that you define. The 'HullMovingAvg' illustrates this very well. Here is its code:
input price = close;
input length = 20;
input displace = 0;

plot HMA = MovingAverage(AverageType.HULL, price, length)[-displace];

HMA.DefineColor("Up", GetColor(1));
HMA.DefineColor("Down", GetColor(0));
HMA.AssignValueColor(if HMA > HMA[1] then HMA.color("Up") else HMA.color("Down"));
In the above HMA>HMA[1] is the condition that says IF the current HMA is greater than the previous value of the HMA, i.e. HMA > HMA[1] , THEN paint the plot with the “Up” color which is defined as color(1) OTHERWISE/ELSE paint the plot with the “Down” color which is defined as color (2). (1) and (2) are color index numbers. Color-assigned-index-numbers are explained in the separate topic.
The condition is always in a 'if…. then…. else' format. If-statements may be nested without limits. The format thenbecomes 'if…..then….. else if…..then…..else if…..then……else'. The closing 'else' is always present and relates to the initialif…. then when none of the nested if …then’s produce a result.
Example:
if SlowK > SlowD then color.green else if SlowK < SlowD then color.red else color.gray
The multiple conditions may be used to define a conditional statements. They are joined by 'and' or its equivalent '&&'.
Example:
def RangeCondition = ADX > 0 && ADX < 13;# ADX is between 0 and 13
Conditions may be nested as in this example:
Diamonds.AssignValueColor(
  If BullishCondition then color.green else
    If RangeCondition then color.white else
      If BearishCondition then color.red else
       color.black);
Note in the above, since color.green, color.white, color.red and color.black are constants and not double variables, the if-expression must be used and that requires the presence of all IF…..THEN…..ELSE parts.
Here is another example of multiple coloring in a label:
AddLabel(1, Concat("IV Percentile ", AsPercent(perct)), if perct > 0.80
  then Color.Green
  else if perct < 0.80 and perct > 0.50
  then Color.Yellow
  else color.Red);
HOW THINKSCRIPT CALCULATES
In scans, conditional orders, and custom quotes there is only one bar, the latest or current bar. All scripts are run in real-time and the script processor only runs one iteration of the script. So within that context, certain functions make no sense, like barNumber(), HighestAll() to name a few, also rec variables. Functions that take a look back value or length, such as average( data, length ), highest( data, length ), etc. work because the internal logic of the function performs the action of looking back. No matter what the timeframe, in those contexts (scans, etc.), your script only runs once and only against the current (latest) bar.
In studies or strategies, ThinkScript runs your script once for each and every bar on your chart, regardless of the aggregation period.
You will often hear knowledgeable programmers say with disappointment that 'ThinkScript' does not have arrays. Arrays are a common powerful programming feature for storing/recalling various data and data types. This is a limitation of ThinkScript that we must live with as best we can.
COLORS AS USED IN TOS/THINKSCRIPT
TOS has defined ten colors corresponding to index numbers on two different background colors as below:
The colors are used via the function 'GetColor(index number);' Example: GetColor(1) as used in the HullMovingAvg previous topic. Reference: [See Index Colors]https://tlc.thinkorswim.com/center/charting/thinkscript/reference/Functions/Look---Feel/GetColor.html
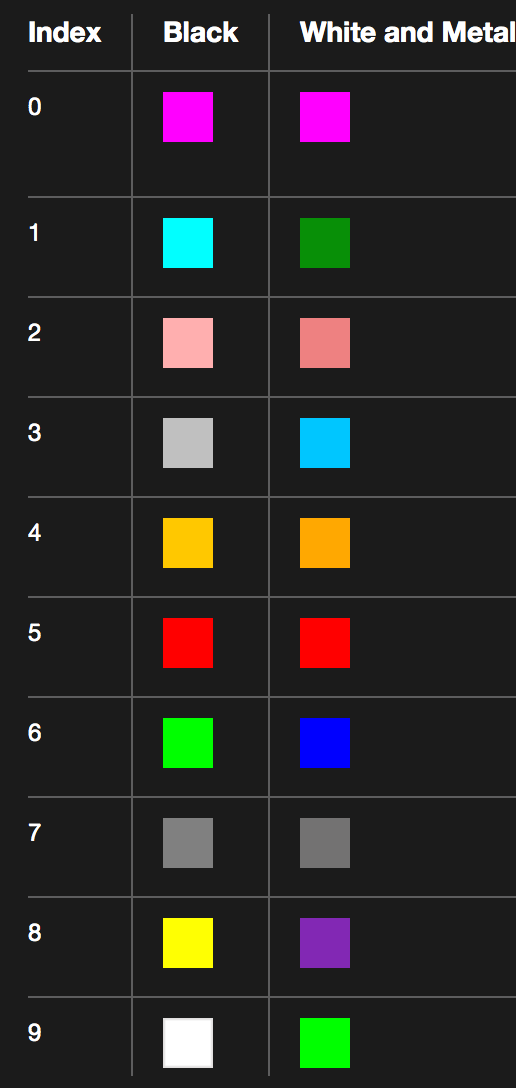
| Index | RGB Values | Name of Color |
|---|---|---|
0 |
255,16,253 |
magenta |
1 |
0,255,255 |
cyan |
2 |
255,174,174 |
pink |
3 |
191,191,191 |
white |
4 |
254,199,22 |
gold |
5 |
255,3,2 |
red |
6 |
0,254,30 |
green |
7 |
127,127,127 |
dark_gray |
8 |
254,254,31 |
yellow |
9 |
255,255,255 |
white |
This free tool will help you to get the RGB values for any color you desire to compose.
TOS has also assigned names to 23 colors per the following:
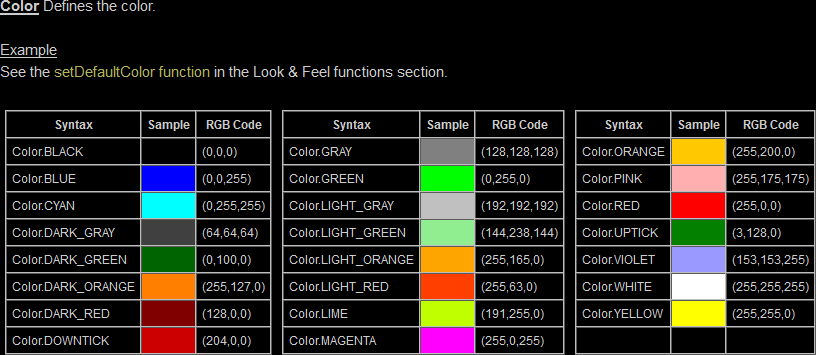
Reference: [See all color constants](https://www.thinkorswim.com/tos/thinkScriptHelp.jsp?laf=dark#constants)
Note that colors 'UPTICK' and 'DOWNTICK' are defined respectively as a red and green tone because they are frequently used in chart coloring. In the above chart the capitalized words are the names used to specify that color i.e. color.CYAN or color.LIGHT_RED.
Not all colors are defined: for example, PURPLE. You may find any color at
http://en.wikipedia.org/wiki/List_of_colors:_A%E2%80%93F or http://en.wikipedia.org/wiki/X11_color_names .
You can create that color for use in TOS by using the function 'CreateColor(double red, double green, double blue); ' similar to the RGB Code in the chart above. Each RGB component ranges in value from 0 (meaning none or 0%) to 255 (meaning the max 100% value).
You may also assign a text-name, for later use, to any color you create via
DefineGlobalColor("Purple" , CreateColor(160,32,240) );
OFTEN USED COLORING CODE STATEMENTS
| When writing code you may not have the coloring coding at your finger tips. This provides a ready place to go to to get the code words to paste. |
Typical chart plot settings
Data.SetPaintingStrategy(PaintingStrategy.LINE);# See Others Painting Strategies below.
Data.SetLineWeight(1);# 1 thru 5. 1 is the default if 'SetLineWeight' is not defined.
Data.SetDefaultColor(Color.White); #Color.'TOS predefined color constant'
See all predefined color constants: See predefined color constants
Other Painting Stategies
- ARROW_DOWN,  ARROW_UP, BOOLEAN_ARROW_DOWN, BOOLEAN_ARROW_UP, BOOLEAN_POINTS,
- DASHES, HISTOGRAM,  HORIZONTAL, LINE,  LINE_VS_POINTS, LINE_VS_SQUARES,   LINE_VS_TRIANGLES,
- POINTS, SQUARED_HISTOGRAM, SQUARES, TRIANGLES,  VALUES_ABOVE,  VALUES_BELOW
LINE is the default if none is specified.
##### For curves define the line styles ####
Data.SetStyle(Curve.SHORT_DASH);
Other constants:
-
FIRM, LONG_DASH, MEDIUM_DASH, SHORT_DASH, POINTS
-
SHORT_DASH is the default value of 'SetStyle'
Assign a name to a color
You may assign a name to a color like:
Plot RSI = 50 * (ChgRatio + 1);
RSI.DefineColor("Normal", GetColor(7));
The name "normal" above is unique to the RSI plot. Another plot cannot use the name 'normal' without redefining it.
To define and name a color for use in multiple plots do as follows:
DefineGlobalColor("normal", CreateColor(128, 0, 128));

plot signal = high > Highest(high[1]);
signal.SetPaintingStrategy(PaintingStrategy.BOOLEAN_ARROW_DOWN);
signal.SetDefaultColor(GlobalColor("normal"));

plot NinetyPercent = 0.9*close;

NinetyPercent.SetDefaultColor(GlobalColor("normal"));
Color based on a condition
plot Diff = close - close[1];
Diff.assignValueColor(if Diff >= 0 then Color.UPTICK else Color.DOWNTICK);
Note that UPTICK and DOWNTICK are TOS predefined color constants
Create your own color
plot Price = close;
Price.SetDefaultColor(CreateColor(255, 220, 210));
Or
DefineGlobalColor("Purple" , CreateColor(160,32,240) );
After the above global definition, GlobalColor("Purple") can be use wherever a color is needed. For example:
Price.SetDefaultColor(GlobalColor("Purple"));
Use predefined index colors
plot Price = close;
Price.SetDefaultColor(GetColor(1));# 1 is an index color of 0 thru 9
Reference: See all color index numbers
Default and global color text names
plot Data = close;
Data.SetDefaultColor(color.RED);
or
Data.SetDefaultColor(GlobalColor("normal"));# Provided 'normal' is previously defined.
IMPLEMENTING LABELS
Labels are boxes of info placed at the top-left of a study. They are very useful and well worth the time to master them.
The label function is AddLabel(boolean visible, Any text, CustomColor color); and has three components.
-
' boolean visible'is a true or false statement that defines when the label shows or doesn’t show. If you use a '1' or 'yes' here it will always show the label, Otherwise you define a condition or an input selection-value that evaluates to 'true' or 'false' and reference that condition statement here. -
'Any text'is what appears inside the label box. There are two way to compose this text using 'concat' or '+' syntax(known as the string concatenation symbol). Concat is a term that means to connect two text phrases together. This includes converting ThinkScript variable-values into text. -
' CustomColor color'defines the background color of the label box. The text font color is always black.
boolean visible
This can be a 'yes' or 'no', or any condition statement or a reference to: (1) a previously defined condition statement; or (2) an input true/false value. When this evaluates to 'true' then the label will show or, when false, will not show. This is very handy when referring to an input whose value choices are 'yes' or 'no'. Programmers use the yes/no input in condition statements to display or not-display certain features such as the labels or plots.
Any text
The label’s text can be defined using using 'concat' or '+' which is known as the string concatenation symbol. Using the '+' symbol is much easier to master and is recommended. Examples will help explain:
input weeks = 4;
AddLabel(yes, concat(weeks, " Weeks till expiration"),  color.YELLOW);
produces the following label:

Using the '' symbol …. `AddLabel(yes, weeks + " Weeks till expiration", color.YELLOW);` produces the same label as above. You will find that complex texts with numerous segments are much easier to compose using the '' symbol. There is, however, one pitfall to be avoided using the '+' symbol as discussed below:
The key is when using the + syntax, one must put all calculations-within-a-label inside of parentheses. Also multiple conditions such as HiTrue && LoTrue should be within parenthesis like (HiTrue && LoTrue).To illustrate this, a right and wrong is shown below:
This works:
input ManADR = 25;
Addlabel(yes,"Exit = Stop Loss @ 10% of ADR = " + (0.10 * ManADR) ,color.PINK);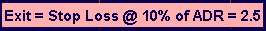
This is wrong and produces an error:
Addlabel(yes,"Exit = Stop Loss @ 10% of ADR = " + 0.10 * ManADR ,color.PINK);
See also LITERAL TEXT IN LABEL FOR THE 11 CHOICES OF INPUT PRICE and C-% CHANGE OF THE FIRST BAR VALUE and C-ADD AN INDEX OR FUTURE LOWER CHART for examples of putting drop-down literals into label text.
CustomColor Color
-
Defines the color of the label box. Conditional coloring can also be had with the addition of if….then…..else statements. There are no limits to the number of conditional statements but they follow the format if…..then….else if…..then…..else if…..then…..else. Note the closing else that relates to the very first 'if…..then'.
You may have a label take on the same color as a plot. The syntax is: ChartPlotName.TakeValueColor()
Tip for moving labels up
There are times when a label interferes with the top of a plotted chart’s data. To avoid that, you can plot a line at the top of the chart at a value above the plots data. The labels will then have their centerline equal to the value of the line.
To make the line invisible, paint it the same color as your background.
Tip for debugging
AddLabel is an excellent tool to observe a value for debugging purposes. In addition to that, a neat trick is, while in the code editor, drag the editor window down so that you can see the chart’s label and header values. That way, when you change the code and press apply, you can see the value change while staying in the code editor.
If you are inclined towards the use of concat, here is a guide on its use as well as an example of conditional coloring.
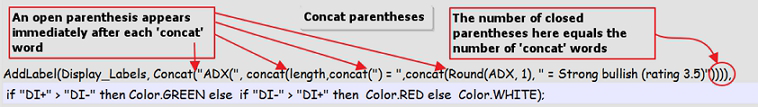
The equivalent using the '+' syntax is:
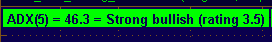
AddLabel(Display_Labels, "ADX(" + length + ") = " + Round(ADX,1) + " = Strong bullish (rating 3.5)", if "DI+" >"DI-" then
Color.GREEN else if "DI-" > "DI+" then Color.RED else Color.WHITE);
The built-in ZigZagPercent study demonstrates the excellent use of conditional showing of the label itself, the use of the + syntax and conditional coloring. The code is duplicated below:
AddLabel(showLabel and barNumber != 1, (if isConf then "Confirmed " else "Unconfirmed ") + "ZigZag: " + round(chg) +
"%", if !isConf then globalColor("Unconfirmed") else if isUp then globalColor("Up") else globalColor("Down"));
SLOPE OF AN AVERAGE herein shows how to reteieve the literal of 'AverageType' choices in a label.
A trap to avoid:
If your definition of the label text involves long and multiple 'if…then…else' statements, to insure that they all print, enclose each 'if…then else' statement in parentheses e.g. '(if…then…else)'. Otherwise, you may not get an error but an 'if…then…else' statement may not print. C- THE 'AdvanceDecline' STUDY herein is an excellent example of this.
AGGREGATION
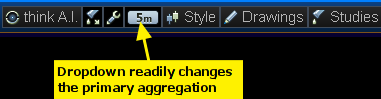
Each bar on a plot represents a period of time known as the primary aggregation: one minute, five minutes, day, etc.
A chart may also have one or more secondary aggregations. Variables are assumed to be of primary aggregation and those of a secondary aggregation must have their aggregation specified every time they are used.
A very common way of specifying the secondary aggregation is:
def Agg = AggregationPeriod.FIFTEEN_MIN;# Use the desired constant to specify the time plot Data = close(period = agg) / close(period = agg)[3];# The phrase 'period =' is always used when referring to the variable aggregation. In this case 'agg'.
You may need to learn other ways of specifying aggregation to read other people’s code such as in the built-in DailySMA.
RULES
-
The secondary aggregation period cannot be less than the primary aggregation period defined by chart settings. This is a hard-fast rule that often comes into play.
-
Two different secondary aggregation periods cannot be used within a single variable. You can define each separately and then use the two definitions in a single statement.
It has been observed that using more than one secondary aggregation may affect the proper plotting. Using 'Expansion Area: ? Bars to the right' in chart settings may have an improvement.
There is a complete tutorial named Aggregation Tutorial,PDF available at http://mytrade.com/StanL
EXPLANATION OF '=' , '==' AND '!'
The difference between = and ==
A single "=" is the assignment operator. The statement "input Show_ChartPeriod = yes;" reads: assign (or set) the memory location labeled 'Show_ChartPeriod' to yes (boolean TRUE);
The double "==" is the logical equality operator. The statement "if AggPeriod == AggregationPeriod.DAY then … else…;" reads: if the variable AggPeriod equals (is the same as) AggregationPeriod.DAY then do something else (otherwise) if it’s not, then do some other thing. When evaluating equality in an 'if' statement, two equal signs must be used ('==').
The ! bang exclamation mark
Not related to the above = and == is the "bang" (exclamation mark). As an example, use isnan() which returns true if the specified parameter is not a number, returns false otherwise. The ! ( exclamation mark called "bang" ) is a logical NOT perator. So if 'isnan(close)' is true i.e. since/when close is not a number then 'isnan(close)' reads as true. Using the "bang" and close remains not being a number, then '!isnan(close)' reads as " NOT close is not a number" or NOT true = false when close is not a number (⇐0).
REFERENCING OTHER STUDIES
This subject is about including existing studies in your code 'by reference' in lieu of duplicating its actual code. The syntax for this procedure is: reference <StudyName>(parameter1=value1,.., parameterN=valueN).<PlotName>
A simple example is: plot MyMACD = reference MACDHistogram;
Occasionally a study and a function may have the same name e.g. vwap and moneyflow. In that case:
- Call the vwap function like ….plot MyVWAP1 = vwap;
- Reference the vwap study like ….plot MyVWAP1 = reference VWAP;
- The use of the word 'reference' is optional but, if 'reference' is omitted, the () must always follow the study’s name. Example: plot MyVWAP1 = VWAP();
In studies, you may reference built-in studies but not user-defined studies in (currently). However, user-defined studies may be referenced in scans.
In the following, the 'StochasticSlow' study will be used as an example for explanation.
Specifying plots
Studies may have a single plot or multiple plots: ' StochasticSlow' has four plots named SlowK, SlowD, OverBought and OverSold. Referencing the SlowD plot would be via StochasticSlow().SlowD Just using StochasticSlow() would plot the SlowK because SlowK is the first plot in the actual code and is the default. Since no parameters are specified, the default parameters specified in the actual code are automatically used. Using parameters is explained below.
Specifying parameters
If you look at the actual code of StochasticSlow study you’ll see that it has a series of "input" variables. Those are the default parameters and cannot be changed because they are in a pre-defined study which is not editable. There are three ways to specify parameters: (1) Full form; (2) Compact form; and (3) A combo of (1) and (2). Specifying no parameters will use all the default values. The parameter list is in a fixed order of inputs from left to right i.e. each parameter/input has a fixed location in the list.
Full form
The full form specifies the input variable name with its intended value. An example is:
def SlowK = StochasticSlow( KPeriod = 10, DPeriod = 10, priceH = High, smoothingType = "SMA" );
Any parameter not listed herein takes on its default value. Note that the names like 'KPeriod', 'DPeriod', 'priceH', 'smoothingType' and others are as defined in the actual code’s input list.
Compact Form
The compact form is simplest in that you simply put your values in the place/position of the default parameter you wish to change. You start with the first input value as the left most value in the reference. An example is:
def SlowK = StochasticSlow( 80, 20, 10, 10, high, low, close, "SMA" ).SlowK;
Note that you cannot omit any intermediate values or modify their positions. Only the right-most parameters may be dropped off and those will then take on their default values.
Combo Form
This allows you to choose only the variables you want to change. An example is:
def SlowK = StochasticSlow( 80, 20, 10, 10, smoothingType = "SMA" ).SlowK;
Here you have omitted the price parameters. Once again, you must preserve the parameter’s position rule.
There are two ways of referencing constant inputs : smoothingType = "SMA" and smoothingType == smoothingType.SMA are equivalent.The first is the short syntax ("SMA"), while the second is the full syntax .
A different but related subject is referencing pre-defined studies using 'Script'. See http://tda.thinkorswim.com/manual/metal/thinkscript/tutorials/advanced/referencing/other%20study.html
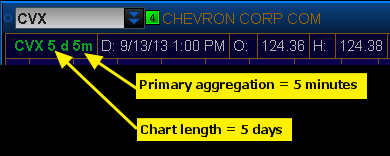
image::12-1.png[]Click the Scroll] image::12-2.png[Click to Change Aggregation]
B&C-NORMALIZATION
If you want to compare two (or more) indicators that have values much different that are non-receptive to comparison, you can normalize each of the two (or more) indicators and compare them on a basis you define i.e. 0 to 100%, -1 to +1, -100 to +100, or whatever you want. Below is the code to do normalization and an example. Note that not all studies can be normalized e.g. 'AccDist' has no parameters and cannot be normalized.
Code that does normalization
#Usage: 'input data = close' is substituted by an indicator and its parameters.
declare lower;

script normalizePlot {
  input data = close;
  input newRngMin = -1;
  input newRngMax = 1;

  def HHData = HighestAll( data );
  def LLData = LowestAll( data );
  plot nr = ((( newRngMax - newRngMin ) * ( data - LLData )) / ( HHData - LLData )) + newRngMin;
}
Examples
input price = close;
input CCI_length = 7;
input Momentum_length = 12;
input RSI_length = 4;
input WR_length = 10;
input newRngMax = 100;#Maximum normalized  value
input newRngMin = 0;#Minimum normalized  value
input OverBought = 80;#Fixed value upper line for reference
input OverSold = 20;#Fixed lower value line for reference

def newCCI = normalizePlot( CCI( CCI_length).CCI, newRngMin, newRngMax );
def newMomentum = normalizePlot( Momentum( length = Momentum_length ).Momentum, newRngMin, newRngMax );
def newWPR = normalizePlot( WilliamsPercentR( length = WR_length ).WR, newRngMin, newRngMax );
def newRSIWilder = normalizePlot( RSIWilder( length = RSI_length ).RSI, newRngMin, newRngMax );

plot CCI = newCCI;
plot Momentum = newMomentum;
plot WPR = newWPR;
plot RSIWilder = newRSIWilder;
plot Over_Bought = 80;
plot Over_Sold = 20;
COUNTING AND USE OF 'COMPOUNDVALUE'
Counting is often used. This shows the construct for a 'def count' variable and also takes this opportunity to define the usage of CompoundValue to initialize this recursive variable. Previous versions of TS would require this to be written as 'Rec count =' statement but TS corrently recognizes both 'def' and 'rec' to define a recursive variable. The below annotated picture explains how counting i s accomplished. Naturally any valid condition may be substituted for the one shown.
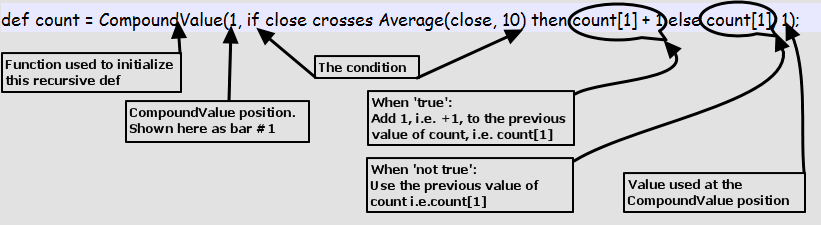
By the way, you can identify a recursive variable definition when the variable itself, in this case 'count', also appears on right side of the equal sign/equation like, in this case, 'count[1]'.
If you have a reason to re-start the counting from 0 or 1 based on a defined condition, you place the condition after the 'else' like 'else if <condition to restart counting> then 0 ' and close with 'else count[1]'.
Refer to PastOffset discussed at [Click to read about it.](https://tlc.thinkorswim.com/center/charting/thinkscript/tutorials/Chapter-13---Past-Offset-and-Prefetch.html) In short, it says that if you have multiple past references in your code, for example 'Average(close, 11) or close[6] ,' the longest past reference value will be used for all past reference' regardless of what your code says. You would use 'CompoundValue' to prevent the longest reference being used by initializing the affected calculation with the 'CompoundValue' function.
LINEAR REGRESSION
There are several built-in Linear Regression studies in ThinkScript. This section is intended to clarify their differences and usage.
Definition = 'Linear regression' is a mathematical procedure know as the 'least-squares method', used for drawing the best straight line thruogh a group of data points. ThinkScript’s linear regression function is titled 'Inertia'. You may view it at
The key studies are:
-
LinearRegCh100
-
LinearRegCh50
-
LinearRegChVar
-
LinearRegCurve
-
LinearRegTrendline
-
LinearRegrReversal
-
LinearRegressionSlope
LinearRegCh100
Uses the data of the entire plot. The upper and lower channel lines, parallel to the centerline (the true linear regression)., indicate the furthest that the data has been from the middle line The '100' in the title means that it shows the upper and lower lines at 100% of the data difference from the centerline .
LinearRegCh50
Is the same as the LinearRegCh100 except that the upper and lower lines ar at 50% of the of the data difference from the centerline in lieu of 100%.
LinearRegChVar
This version allows the user to define the 'percentage-distance-from-the-centerline' of the upper and lower lines. Also, this version allows the user to select the number of bars for the linear regression plot in lieu of the previous two studies that use the entire chart (all bars).
LinearRegCurve
Plots a single curve in which you have defined the type of price and the number of bars as the basis for the curve.
LinearRegTrendline
Uses the data of the entire chart. Plots a straight linear regression line for whichever of the eleven choices you have selected. The choices include other than price items such as volume and 'imp volatility'.
LinearRegrReversal
This study indicates "+1" when the current value of Linear Regression Curve is equal to or greater than that of the previous bar and "-1" otherwise. If you compare this to the LinearRegCurve be sure to use the same number of bars input for each study.
LinearRegressionSlope
Plots the changing slope of the LinearRegCurve based on the price and length that you select.
Note that LinearRegCurve, LinearRegTrendline, and LinearRegressionSlope all have the same eleven price input choices.
Studies #1, #2 and #3 are very popular in searching for stocks that are at buy-low prices. You may find these especially beneficial to learn and comfortably use them.
TWO WAYS TO CALCULATE % CHANGE
There are two ways to calculate a % change. You may see both ways used in coding.
As an example let 10 be the original value (B4) and 15 the final value (NOW). NOW/B4 is the "RATIO"
First way:
In words, final value divided by the original value; minus one; times 100. or 15/10 = 1.5; 1.5 - 1 = 0.5; 0.5 X 100 = 50 % increase
Example:
def length = 10;(1)
def price = close; # The current close. This is the "NOW" value
plot PercentChg = (price / price[length] - 1) * 100; # or (NOW / B4) - 1 is RATIO - 1 and "RATIO - 1" multiplied by 100 equals the PERCENT CHANGE. If the "RATIO' is below or above the value of ONE, then the % change is above or below 100% respectively| 1 | [10] means 10 agg-bars ago This is the "B4" value |
Second way:
In words, the change difference (NOW minus the B4) divided by the original (B4) value times 100. or 15 -10 = 5 = change difference; 5/10 = 0.5; 0.5 X 100 = 50% increase.
If the difference (B4 - NOW) is negative the percent is also negative i.e. 'decrease'. Also if the "RATIO" (NOW/B4) is less than zero then the percent change will be negative.
Example:
def length = 10;# [10] means 10 agg-bars ago
def price = close; # The current close

plot PercentChg = ((price  - price[length])/ price[length]) * 100;# ((NOW-B4) / B4) * 100 which is the same as (NOW/B4 B4/B4) * 100 which is the same as (NOW/B4 - 1) * 100.  The % change is up or down if the difference is plus or minus respectively.
Additional Comments:
The two ways above example, "value1 is what percent larger/smaller than value2." For value1 = 85 and value2 = 38 then: 85 /38 = 2.24; 2.24 X 100 = 224%. In words value1 is 224% of value2. Or, in a different way, it can be said that 2.24 -1 = 1.24 X 100 = 124% which reads that value1 is 124% larger than (or above) value2.
An aside: A calculated value of -0.0331 will be formatted with 'AsPercent' to show the below label in cyan.
input length = 9;
AddLabel(yes, AsPercent((close - close[length]) / close[length]),color.cyan);
FORMATTING WITH 'AsText', 'AsDollars' AND OTHERS
The following formatting functions are especially useful in custom columns and labels.
An 'AsDollars' example
def x = CompoundValue(1, if IsNan(GetActualEarnings()) then x[1] else GetActualEarnings(), GetActualEarnings());
AddLabel(yes, "'Earnings = " + asDollars((round(x,2))) + "'", color.cyan);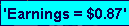
An 'AsText' plus 'decimal-places' example
def x = CompoundValue(1, if IsNan(GetActualEarnings()) then x[1] else GetActualEarnings(), GetActualEarnings());
AddLabel(yes, "'Earnings = " + AsText(x,NumberFormat.TWO_DECIMAL_PLACES) + "'", color.cyan);
Comment: 'NumberFormat.TWO_DECIMAL_PLACES', 'NumberFormat.THREE_DECIMAL_PLACES' and 'NumberFormat.DOLLAR' are the three choices that can be used with 'AsText'. Using 'NumberFormat.DOLLAR' produces the same look as using 'AsDollars'. Also the decimal places can be gotten by using the Round() function as shown above in the 'AsDollars' example.
An AsDollars example
AddLabel(yes, "Current True Range is " + AsDollars(TrueRange(high, close, low)),color.cyan);

An AsPercent example
def Range = 1 - ((high - close)/ (high - low));
AddLabel(yes,"Range percent = " + asPercent(round(Range,2)),color.cyan);
An AsPrice example
AddLabel(yes, "10 period SMA of Close price using 1/32nds price notation (XXX’YYZ) = "+ AsPrice(Average(close, 10)),color.cyan);

LITERAL TEXT IN LABEL FOR THE 11 CHOICES OF INPUT PRICE
#Puts any of the 11 price choices into a literal text in a label like ohlc4 = 75

input price = close;#Price automatically avails 11 choices and the label below tells which was selected.

#Puts any of the 11 price-choices into a literal text in a label like ohlc4 = 75

input price = close;#Price automatically avails 11 choices

AddLabel(yes, if price == close then "The price-variable selected is close = " + Round(close,2)
else if price == open then ""The price-variable selected is open = " + Round(open,2)
else if price == high then ""The price-variable selected is high = " + Round(high,2)
else if price == low then ""The price-variable selected is low = " + Round(low,2)
else if price == hl2 then ""The price-variable selected is hl2 = " + Round(hl2,2)
else if price == hlc3 then ""The price-variable selected is hlc3 = " + Round(hlc3,2)
else if price == imp_volatility then ""The price-variable selected is current imp_volatility = " + AsPercent(imp_volatility)
else if price == ohlc4 then ""The price-variable selected is ohlc4 = " + Round(ohlc4,2)
else if price == open_interest then ""The price-variable selected is Open_interest = " + Round(open_interest,0)
else if price == volume then ""The price-variable selected is Volume = " + Round(volume,0)
else if price == VWAP then ""The price-variable selected is VWAP = " + Round(VWAP,0)
else "N/A" + price,color.white);
Comments: The 11 choices of Price are close, high, hl2, hlc3, imp_volatility, low, ohlc4, open, open_interest, volume, vwap.
WHAT IS SWING-HIGH, SWING-LOW
What is a swing high / low? Basically a swing high is the highest high looking a few bars back and a few bars forward. A swing low is the lowest low looking a few bars back and a few bars forward. The more bars you include in the series, the more significant the swing, but the confirmation comes further from the actual swing point. If you wanted to define a swing high as a bar high that is higher than the highs of the two bars just before it AND higher than the highs of the two bars just after it, the thinkscript code would look like this:
Def swinghigh = if high > high[1] and high > high[2] and high > high[-1] and high > high[-2] then 1 else 0;
Or if you are interested in the rise of the last 5 bars, you may use something like this:
plot pivotHigh = if high == (highest(high, 5) and sum(high > high[-1], 5) == 5) then high else Double.NAN;
The code for a swing low is similar. Note that the confirmation of a swing point does not come until 2 bars after the swing high in this case. If you wanted to extend the swing check to 3 bars before and after, you would add the checks for a high > high[3] and high > high [-3]. The resulting swing will be more significant, but the signal comes 3 bars after the fact.
To plot the swing high you could code it like this:
Plot swing_hi = if swinghigh then high else double.nan;
swing_hi.setstyle(curve.points);
This would paint a dot on all the swing highs, and nothing everywhere else. The code for swing lows is similar.
This is the simplified basics of swingHi/SwingLo. Many coders add all kinds of conditions to supplement the simplified code herein. Also the look-back and the look-forward lengths do not need to be the same.
COMPARISON TO ANOTHER INSTRUMENT
Comparison to another stock, index or any instrument having a symbol.
-
Click 'studies' then 'Add Study' then 'Compare With'
-
If none of the ready-made comparisons have what you want, then click 'Custom Symbol….'
-
You will then be presented with the following dialog:
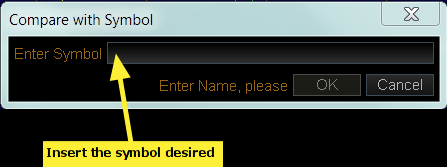
If you have forgotten or are unsure of the symbol, you can find it easily as follows:
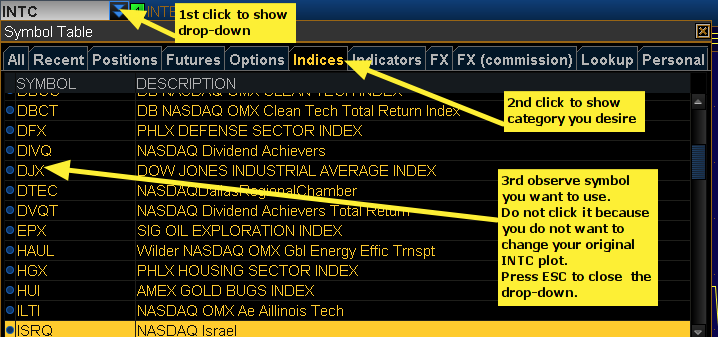
The comparison will be overlaid on the upper panel using the left-hand price scale. You can edit the study to change the symbol or the type of plot, i.e. Line, Bar, Candle, or the color. Choose any aggregation but 'day' is most meaningful.
THE FOLD FUNCTION EXPLAINED
The Fold syntax is:
def <result> = fold <index> = <start> to <end> [ with <variable> [ = <init> ] ] [ while <condition> ] do <expression>;
Each component of the fold function will be explained separately. The function is not easy to use but understanding the purpose of the components will help you to feel comfortable with it.
General Comment:
-
The fold function is used to define the value for a named variable i.e. def <result>. You cannot operate on other variables or do anything within the fold. Studies may be used within a fold.
-
Rather than define a variable, the fold may be plotted directly i.e. def <result> = becomes Plot <result> =.
-
Remember that the fold calculation is executed at every bar as ThinkScript processes from bar 1 to the last bar.
-
As discussed in GetValue below, studies may be used in the Fold function especially in the do <expression>.
-
The names assigned <index> and <variable> are persistent variables. Hence, if you have two folds in a study and you assign 'idx' to <index> in the first fold you cannot assign 'idx' to <index> in the second fold. This will create an error.
-
Fold will normally work in a scan and custom columns. Complexity may become an issue especially if the servers are loaded up.
-
fold
-
A fixed word that identifies the following as a 'Fold' function.
-
<index> = <start> to <end>
-
This defines how many times the fold calculation loops on each bar. You need to figure out how many times "fold" needs to repeat itself, OR at what value it is going to stop churning away. Let’s say you want a calculation to repeat 5 times. If the <start> is at 0 and the <end> is at 5, then the calculation will repeat 5 times. <start> is inclusive but <end> is exclusive. When the counter gets to 5, fold stops and there is no results related to loop 5. <index> can be any name you want but 'i' or 'index' is commonly used e.g. i = 0 to 50. The value of the index can be used in the do <expression>. When <index> is used in the do statement, the last value of <index> is used and not the current value. The current value would be <index> + 1.
-
[ with <variable> [ = <init> ] ]
-
First of all, anything within brackets is optional. So when/why would you include this.?The answer lies in that this is an internal variable that fold uses. So when is it needed? If the 'do' section of the fold performs a activity like 'add to', 'multiply by' or similar, it must have a previous number to 'add to' for example. This 'with <variable>' is the value that will be added to when you see code like 'do nice + idx3'. This means that 'nice' is the with <variable> that fold has been keeping tract of internally and '+ idx3' is the current loop’s calculated value that is to be added to nice. 'nice + idx3' then becomes the new value of the internal variable nice and nice is available for the next loop’s calculation. <variable> can be any name you want to assign. In this example, 'nice' was used.
-
[ = <init> ] is the initial value of the 'with <variable>' and is optional. If it is omitted, then the default value of 0 is used. <init> is a number. Since it is in brackets, it is optional if there is a with <variable>.
-
[ while <condition> ]
-
This defines a condition, upon violation of which, the loop (not the fold itself) is terminated when calculating the fold function and TOS procedes to the next bar. The fold will do some action but that action may be subject to certain conditions. This [ while <condition> ] defines conditions/ limitations that are imposed on the actions that follow. The conditions may qualify the do-actions results or they may define conditions that terminate any further loops at the current bar. Conditions here do not preclude the 'do' statements from having an 'if' statement that may also set conditions but those conditions are used in getting the desired result from the 'do' statement. A example would look like
-
'while close > 40'.
-
do <expression>
-
Defines an action to be performed, for each loop, when calculating the fold function. The do <expression> may be of numerous types. For example, if it is a true/false type then the fold results will be a true/false. Or it may be a arithmetic type like 'do nice * index' which multiplies fold’s internal variable, nice, by the index value. Another example is 'do nice + getValue(close, n, length - 1)) / length'(a simple moving average) which gets a close value; divides it by a length variable; and adds it to the internal variable, nice. Or it may be a more complicated fold such as: fold i = 0 to 100 with price = Double.NaN while !IsNaN(price) do if getValue(high, -i) > 40 then getValue(high, -i) else Double.NaN; This finds the next high price value greater than 40 among the following 100 bars and terminates looping if price is no longer a number.
-
GetValue function
-
The syntax for GetValue is: GetValue(IDataHolder data, IDataHolder dynamic offset, int max offset);
-
A discussion of fold would not be complete without discussing the GetValue function. This function goes and gets data used in the do <expression>.
-
The third parameter, int max offset,is a fail stop value to prevent an endless loop in the scripting engine. Ideally it should be set to the maximum number that the dynamic index is expected to be. Set it too small and the script engine stops the loop before all index values are processed. Set it too high and you may unnecessarily be wasting server capacity. It would be OK to set it a little higher than you know is needed. If the script engine hits the stop value you’ll get a run-time error message.
Note that int max offset is a fixed integer value, while IDataHolder dynamic offset is an expression that defines the offset value. The expression used for the IDataHolder dynamic offset often has a length parameter in it and that length parameter is also the value used for int max offset. Two very popular expressiona for IDataHolder dynamic offset are LookUpHighest(price,'look up price',length) and LookUpLowest(price,'look up price',length). The length inthese two studies is often the value that int max offset is set to.
-
do <expression>
Examples of
-
The heart of the fold function is the 'do expression' which is crucial for success but is not naturally intuitive. A number
-
of examples may be helpful.
-
Example 1 :
-
input n = 10;
-
plot factorial = fold index = 1 to n + 1 with Var = 1 do Var * index;
-
Calculates the factorial of a number. 10 loops are executed and each loop is multiplied by the value of the previous loop.
-
The initial value for the start of the first loop is 1.
Example 2 :
input price = close;
input length = 9;
plot SMA = (fold n = 0 to length with Var_ma do Var_ma + getValue(price, n, length - 1)) / length;
Calculates the simple moving average using fold. 9 loops are run i.e. 0 thru 8 with the internal variable named Var_ma.
Note the importance of the index starting with 0. The first value is getValue(price,n) or price[0] . If the index was to be 1 thru 10, the current value of price would not be included in the average because the first value would be price[1].
Example 3:
input length = 10;
def Test = fold index = 0 to length + 1 with nice = 0 do nice + index;
AddLabel(1,"Test = " + test, color.green);
This simple fold sums the 'index' values. The AddLabel enables you to change any variable and predict what the label will show. If not determine where your thinking went astray.
Example 4:
input length = 10;
def bigCount = compoundValue( 1, fold idx = 1 to length with a = 0 do a + bigCount[1], 1 );
This is interesting because it illustrates the concept of the fold and def being applied to every bar. The def causes each bar to hold the value of bigCount and the fold’s 'do a + bigCount[1]' essentially causes each bar to be increased by a factor of 9 due to its looping. It is easy to see that the result will eventually reach infinity for a normal sized chart. It’s not likely that you will ever use a def value in a do statement of a fold like this. This is known as a runaway calculation.
Example 5:
input length = 10
def smlCount = compoundValue( 1, fold idx2 = 1 to length with b = 0 do if smlCount[1] >= 1000 and b >= 1000 then 1000 else b + smlCount[1], 1 );
This allows 'smlCount' to rise to 1000 and then it limits smlCount toa value of 1000.
Example6:
plot Test = fold i = 0 to 4 with x = 1 do x + i;
What is the value of test? If your answer was not 7, rethink it.
If we change it to:
`plot Test = fold i = 1 to 5 with x = 10 do x + i; `
What is its value?
If your answer was not 20, rethink it.
Example7:
input period = 20; #hint period:Number of bars to look in
def Hi = fold i = 0 to period with n = high do Max(n, GetValue(high, i, period - 1));
def Lo = fold k = 0 to period with m = low do Min(m, GetValue(low, k, period - 1));
AddLabel(1, "High in last " + period + " bars = " + Round(Hi,2), Color.GREEN);
AddLabel(1, "Low in last " + period + " bars = "  + Round(Lo,2), Color.GREEN);
Labels allow you to look at the chart and verify the values.
Example8:
input length = 21;
def SDr = StDev(r, length);
plot IVSwitch = ( fold i = 0 to length with count do count + if SDr[i] <= SDr  then 1   else 0 ) / length;
This fold counts the number of times, in the last 20 bars, the SDr (std dev of the change ratio) has fallen below the SD.
Example9:
declare lower;
input volTarget        = 200000;
input length           = 20;
plot atLeastVolumeTgt  = fold idx = 0 to length + 1 with s = yes while s == yes do if GetValue( volume, idx, length + 2 ) >volTarget then yes else no;
The above works as a study, omit the "declare lower;" if you want to use it directly in a scan or column.
This code that will check for "daily" average volume greater than 200,000 in the last 20 days, meaning that the stock should have traded at least 200,000 shares every single day for at least the last 20 days. If it complies, 1 is plotted if not 0 is plotted. In a study, it is more meaningful to put the 1 or 0 result in an clarifying label.
ACCESSING THE CONDITION WIZARD
-
The wizard, short for 'Condition Wizard', is a valuable and beneficial tool. This item is here to insure that it is clear about how to access the wizard. The wizard is auto accessible when coding new studies. Editing existing studies does not have the wizard accessible but the wizard in the following picture can be used and the wizard result can be copied for pasting in the existing study editing.
In the above 'Scan/StockHacker' tab, all fundamental filters have been deleted using 'red-circled-X'.
-
To re-establish, click 'Add Fundamental Filter'. Only a 'Study Filter' is showing now.
THE STOCHASTIC OSCILLATOR EXPLAINED
Comment 1: The stochastics indicator can be confusing because it is referred to as: 1. Fast Stochastics; 2. Slow Stochastics; or 3. Full Stochastics. This video gives a clear explanation of the differences between the three in Part 1 and usage in Part 2. See video (2 parts)
Comment 2: While at this site check out the other indicator tutorials that may interest you. View indicator tutorial list
THE STANDAED DEVIATION (SD) EXPLAINED
The Standard Deviation (SD) is used frequently in TOS studies and its concept needs understanding.If you have 100 random datapoints, they combine to have an average (a single value). The distance of each of the 100 datapoints from the average is used to calculate (via a mildly complex formula) what is called the Standard Deviation (often abbreviated as SD). In essece, the SD is a measure of dispersion of the 100 datapoints. If most datapoints are close to the average, the SD will be low (i.e. low dispersion or deviation). If most datapoints are widely scattered, the SD will be larger (i.e. high dispersion or deviation). The datapoints are assumed to be a normal distribution curve (is prevalent in most statistical analyses).
See the picture below. SD of 1, 2 or 3 are arbitrary distances-from-the-average of a normal distribution curve, that people use for easy discussion or reference. A distance of +/- 1 SD from the average will include 68% of the 100 datapoints(0.68 X 100 = 68). A distance of +/- 2 SD from the average will include 95% of the 100 datapoints(0.95 X 100 = 95). A distance of +/- 3 SD from the average will include 99.7% of the 100 datapoints(0.997 X 100 = 99.7).
Whenever you see 'squared' or 'square root' in a technical calculation, SD is likely involved because 'squared' and 'square root' are used to calculate the SD in that mildly complex formula . Also, whenever someone talks of a 'Gaussian distribution' they are talking of a 'normal distribution' curve. Likewise for 'Bell curve'.
SD values
Studies and Coding
C-UPPER & LOWER BANDS AT DEFINED PERCENT
#hint:Draws upper & lower bands at defined percent
input length = 10;#hint length:Length of base ExpAverage
input percentShift = 5.0;#hint PercentShift: Percent of upper & lower bands from ExpAverage
input price = close;#hint price: Basis for base ExpAverage

def base = ExpAverage(price, length);

plot UpperBand = base * (1 + percentShift / 100);
UpperBand.setDefaultColor(GetColor(1));

plot LowerBand = base * (1 - percentShift / 100);
LowerBand.setDefaultColor(GetColor(1));

assignBackgroundColor(if close > upperBand then color.Green else color.current);
C-STANDARD DEVIATION CHANNELS
-
Standard deviations follow the 68–95–99.7 rule. That is, that a data distribution with a 1 standard deviation (SD) contains 68% of all data. Likewise 2 SD contains 95% and 3 SD contains 99.7%.
#STD Deviation channel plots

input price = close;#hint Price:The choice of what is being plotted.
input length = 14;#hint length:The agg-bars of the average which is the basis for the SD channels

input SD1Up = 1;
input SD1Dn = -1;
input SD2Up = 2;
input SD2Dn = -2;
input SD3Up = 3;
input SD3Dn = -3;
def avg = Average(price, length);
def StdDev = StDev(price, length);
plot StDev1Up = avg + (SD1up * StdDev);
plot StDev1Dn = avg + (SD1dn * StdDev);
plot StDev2Up = avg + (SD2up * StdDev);
plot StDev2Dn = avg + (SD2dn * StdDev);
plot StDev3Up = avg + (SD3up * StdDev);
plot StDev3Dn = avg + (SD3dn * StdDev);
C-THE SIMPLEST REC IN THINKSCRIPT
To comprehend a recursive statement, start with the simplest in concept. Here the previous value is recalled so 1 can be added to it to form the new value of x. In realtime coding, the +1 is replace by all kinds of conditions and resulting actions.
#Straight line REC  =  2 to (number-of-bars + 1)
Def x = x[1] + 1;
plot y = x;
Alternate: Subject to an 'if' statement:
plot y =  if x <= 200 then x else double.NaN ;
C-EXAMPLE OF 4 NORMALIZATIONS
Usage: 'input data = close' is substituted by any indicator and its parameters.
declare lower;
script normalizePlot {
input data = close;
input newRngMin = -1;
input newRngMax = 1;
def HHData = HighestAll( data );
def LLData = LowestAll( data );
plot nr = ((( newRngMax - newRngMin ) * ( data - LLData )) / ( HHData - LLData )) + newRngMin;
}
Examples
input price = close;
input CCI_length = 7;
input Momentum_length = 12;
input RSI_length = 4;
input WR_length = 10;
input newRngMax = 100;#Maximum normalized  value
input newRngMin = 0;#Minimum normalized  value
input OverBought = 80;#Fixed value upper line for reference
input OverSold = 20;#Fixed lower value line for reference

def newCCI = normalizePlot( CCI( CCI_length).CCI, newRngMin, newRngMax );
def newMomentum = normalizePlot( Momentum( length = Momentum_length ).Momentum, newRngMin, newRngMax );
def newWPR = normalizePlot( WilliamsPercentR( length = WR_length ).WR, newRngMin, newRngMax );
def newRSIWilder = normalizePlot( RSIWilder( length = RSI_length ).RSI, newRngMin, newRngMax );

plot CCI = newCCI;
plot Momentum = newMomentum;
plot WPR = newWPR;
plot RSIWilder = newRSIWilder;
plot Over_Bought = 80;
plot Over_Sold = 20;
C-DATE LABEL IN MM/DD/YYYY FORMAT
#hint produces a date label in MMDDYYYY format
def year = (Round(GetYYYYMMDD() / 10000, 0));#Thie produces the year as1,210
def Month = GetMonth();
def Day = GetDayofMonth(GetYYYYMMDD());
def date = GetYYYYMMDD() * 10000 + GetMonth() + GetDay() + 1;
AddLabel(yes,"date: " + Month +"/" + Day + "/" + AsPrice(Year) , Color.WHITE);
C-USAGE OF THE SWITCH FUNCTION
Here is a example of the 'switch' function being discussed:
The switch statement is used to control the flow of program execution via a multi-branch using the enum Def, and enum input: Its features are:
-
It processes an enumeration: In this case 'input exchange'. Each enum value has a case ????: where ???? is the enum value.
-
If each item in the enum’s list i.e. {default NYSE, NASDAQ, AMEX}, does not have a case, then there must be a case default: In this example, each of the enums has a case so there is no case default:.
-
If a case default: is present, its code is applicable to ALL the enum values that do not have a case.
-
The variables being processed, i.e. 'def advances;' and 'def declines;', must be addressed in each case ????: Otherwise an error is produced.
-
Any enum item having a space should have that item enclosed within quotes whenever used.
-
Use of a switch inside a switch is possible but is very complex. Hence it is not addressed herein.
Other examples of switch usage can be found at S-PRICE DIRECTION SCAN , S-PRICE DIRECTION SCAN, C-ATR TRAILING STOP and C- THE 'AdvanceDecline' STUDY
C-HORIZONTAL LINES OF HIGHEST-HIGHS AND LOWEST-LOWS
#Hint: Plots Horizontal lines of highest-highs and lowest-lows
#TOS Name = HorizLines_HH_LL
input length = 20; #hint length: The number of bars being evaluated for the HH and LL. Also is the length of the longest lines. Longer lines may show when two adjacent lines have the same HH or LL values.

input ShowHi_Lines = yes;#hint ShowHi_Lines:Shows or hides HH lines
input ShowLo_Lines = yes;#hint ShowLo_Lines:Shows or hides LL lines

def a = Lowest(low, length);
def b = if low == a then a else b[1];

plot LL_Lines = if b == 0 then double.nan else if ShowLo_Lines then b else double.nan;
LL_Lines.SetPaintingStrategy(paintingStrategy.hORIZONTAL);

def d = Highest(high, length);
def e = if high >= d then d else e[1];

plot HH_Lines = if ShowHi_Lines && e == 0 then double.nan else if ShowHi_Lines then e else double.nan;
HH_Lines.SetPaintingStrategy(paintingStrategy.horizontal);
Alertnate 1:
#hint <b> Highest High and Lowest Low lines & bubble for 3, 6 or 12 momths</b>

declare upper;
input timeFrame = { default threeMonths, sixMonths, twelveMonths };#hint timeFrame: select the TimeFrame desired

def numBars;
switch( timeFrame ) {
  case threeMonths:
    numBars       = 63;
  case sixMonths:
    numBars       = 126;
  case twelveMonths:
    numBars       = 252;
}

def barNum        = if IsNaN( close ) then Double.NaN else barNumber();
def lastBar       = HighestAll( barNum );
def startBar      = if lastBar <= numBars then 1 else lastBar - numBars;
def numMonths     = round( ( lastBar - startBar + 1 ) / 21, 0 );
def Hidata;
def Lodata;

if barNum < startBar then {
    Hidata           = Double.NaN;
    Lodata           = Double.NaN;
  } else {
    Hidata           = high;
    Lodata           = low;
}

def highestData   = HighestAll( Hidata );
def lowestData    = LowestAll( Lodata );
plot HighestHigh  = highestData;
plot LowestLow    = LowestData;

#===================[ Look & Feel ]=====================
HighestHigh.SetPaintingStrategy( PaintingStrategy.LINE );
HighestHigh.SetLineWeight(5);
HighestHigh.SetDefaultColor(Color.PINK);
HighestHigh.HideBubble();
LowestLow.SetPaintingStrategy( PaintingStrategy.LINE );
LowestLow.SetLineWeight(5);
LowestLow.SetDefaultColor(Color.PINK);
LowestLow.HideBubble();

AddChartBubble( barNum == startBar, HighestHigh,  "Highest High in " +   numMonths +  " Months" , Color.cyan, yes );
AddChartBubble( barNum == startBar, LowestLow,    "Lowest Low in " +  numMonths  + " Months" , Color.pink, no  );
Alertnate 2:
#hint:<b>Plots a line for the highest in the last ? bars</b>\nHas option for a % lower plot

declare upper;
input numBars = 50;#hint numBars: The number of bars monitored
input price = high;#hint price:Select the price to monitor
input hidePctLowerPlot = yes;#hint hidePctLowerPlot: Yes hides the hidePctLowerPlot
input PctLower = 5;#hint PctLower: define the % lower plot criteria

def barNum = barNumber();
def lastBar = HighestAll( if IsNaN(price) then 0 else barNum );
def startBar = if lastBar <= numBars then 1 else lastBar - numBars;
def totBars = if lastBar <= numBars then lastBar else numBars;
def data = if barNum < startBar then 0 else price;
def highestData = HighestAll( data );

plot HighestHigh = highestData;
plot PercentDown = highestData * (1 - (PctLower/100));
HighestHigh.SetPaintingStrategy( PaintingStrategy.LINE );
HighestHigh.SetLineWeight(3);
HighestHigh.AssignValueColor( color.CYAN );
#HighestHigh.SetDefaultColor(Color.CYAN);
HighestHigh.HideBubble();
PercentDown.SetStyle( Curve.SHORT_DASH );
PercentDown.SetLineWeight(1);
PercentDown.SetDefaultColor(Color.RED);
PercentDown.HideBubble();
PercentDown.SetHiding( hidePctLowerPlot );

AddChartBubble( barNum == startBar, HighestHigh, "Highest High in the Past " + totBars + " bars: "  + HighestHigh, color.CYAN );
AddChartBubble( barNum == startBar and !hidePctLowerPlot, PercentDown,
PctLower + " % Below Highest High in the Past " + totBars + " bars: "  + PercentDown,
color.RED );
C-VARIOUS MARKET TIME VARIABLES
input showOnlyToday = YES;
input Market_Open_Time = 0930;
input Market_Close_Time = 1600;

def day = getDay();
def lastDay = getLastDay();
def isToday = if(day == lastDay, 1, 0);
def shouldPlot = if(showOnlyToday and isToday, 1, if(!showOnlyToday, 1, 0));
def pastOpen = if((secondsTillTime(Market_Open_Time) > 0), 0, 1);# True if market is already open i.e past 9:30 AM
def pastClose = if((secondsTillTime(Market_Close_Time) > 0), 0, 1);# True if market is already closed i.e. past 4:30 PM
def marketOpen = if(pastOpen and !pastClose, 1, 0);# True if market is past the open but before the close i.e. market is open

def firstBar = if (day[1] != day, day - 1, 0);
#EOD stands for End of Day
def EOD = secondsFromTime(1600) > 0; #After 4 pm, EOD is true
C-VERTICAL LINES (3 STUDIES)
#hint:Places vertical lines at start and end times
#TOS title = VertLines_at_START_END_times
input Start = 1000;
input End = 1200;
def StartTime = SecondsFromTime(Start) ==0;
def EndTime = SecondsFromTime(End) ==0;
AddVerticalLine(StartTime,"Start",Color.GREEN,Curve.SHORT_DASH);
AddVerticalLine(EndTime,"End",Color.GREEN,Curve.SHORT_DASH);
#hint:A vertical line at a specific time
Input time = 1200;
def starttime = secondsFromTime(time)==0;
def ext = if starttime then close else ext[1];
plot x = ext;
AddVerticalLine(starttime, "Time = " + time , color = Color.Green, stroke = Curve.POINTS);
Vertical lines with the most flexibility/options#hint:Places vertical lines at start and end times of all days or selected days.\n Realize that, when certain times are inputted, the lines may overlap.
#TOS title = SC_Vertical_Lines_Most_Flexible
input day_of_week = {default Monday, Tuesday, Wednesday, Thursday, Friday, Saturday, Sunday, Everyday};
input Start_Time = 930;
input End_Time = 1600;
input StartOrEnd = {default StartOnly,EndOnly,Both};
def every = If Day_of_Week == day_of_week.Everyday then 1 else 0;
def StartTime = SecondsFromTime(Start_Time) == 0;
def EndTime = SecondsFromTime(End_Time) == 0;
AddVerticalLine(StartOrEnd == StartOrEnd.StartOnly && StartTime && (GetDayofWeek(GetYYYYMMDD()) == day_of_week + 1 or every),"Start_Time = " + Start_Time,Color.GREEN,Curve.SHORT_DASH);
AddVerticalLine(StartOrEnd == StartOrEnd.EndOnly && EndTime && (GetDayofWeek(GetYYYYMMDD()) == day_of_week + 1 or every),"End_Time = " + End_Time ,Color.GREEN,Curve.SHORT_DASH);
AddVerticalLine(StartOrEnd == StartOrEnd.Both && StartTime && (GetDayofWeek(GetYYYYMMDD()) == day_of_week + 1 or every),"Start_Time = " + Start_Time,Color.GREEN,Curve.SHORT_DASH);
AddVerticalLine(StartOrEnd == StartOrEnd.both && EndTime && (GetDayofWeek(GetYYYYMMDD()) == day_of_week + 1 or every),"End_Time = " + End_Time,Color.GREEN,Curve.SHORT_DASH);C-VERTICAL LINES AT INPUTTED BAR LOCATIONS
#hint: <b>Plots a vertical line at up to 6 specified agg-bars-locations.</b>\n#LinePos1 must always be greater than 0. Set any other LinePos to zero (0) to omit its display.
#By R. Houser Modified by StanL

declare upper;
input linePos1    = 10;#hint linePos1:Must be greater than zero
input linePos2    = 20;#hint linePos2:Enter the agg-bars larger than previous input. Enter zero to omit the plot.
input linePos3    = 50;#hint linePos3:Enter the agg-bars larger than previous input. Enter zero to omit the plot.
input linePos4    = 100;#hint linePos4:Enter the agg-bars larger than previous input. Enter zero to omit the plot.
input linePos5    = 150;#hint linePos5:Enter the agg-bars larger than previous input. Enter zero to omit the plot.
input linePos6    = 200;#hint linePos6:Enter the agg-bars larger than previous input. Enter zero to omit the plot.

Assert( linePos1 > 0, "linePos1 must be greater than zero" );
Assert( linePos2 == 0 or linePos2 > linePos1, "linePos2 ("+linePos2+") must be zero or greater than linePos1  ("+linePos1+")" );
Assert( linePos3 == 0 or linePos3 > linePos2, "linePos3 ("+linePos3+") must be zero or greater than linePos2  ("+linePos2+")" );
Assert( linePos4 == 0 or linePos4 > linePos3, "linePos4 ("+linePos4+") must be zero or greater than linePos3 ("+linePos3+")" );
Assert( linePos5 == 0 or linePos5 > linePos4, "linePos5 ("+linePos4+") must be zero or greater than linePos4 ("+linePos4+")" );
Assert( linePos6 == 0 or linePos6 > linePos5, "linePos6 ("+linePos4+") must be zero or greater than linePos5  ("+linePos5+")" );

def barNum        = if IsNaN( close ) then Double.NaN else BarNumber();
def highestBarNum = HighestAll( barNum );
def show1         = if barNum == highestBarNum - linePos1 then yes else no;
def show2         = if linePos2 > linePos1 and barNum == highestBarNum - linePos2 then yes else no;
def show3         = if linePos3 > linePos2 and barNum == highestBarNum - linePos3 then yes else no;
def show4         = if linePos4 > linePos3 and barNum == highestBarNum - linePos4 then yes else no;
def show5         = if linePos5 > linePos4 and barNum == highestBarNum - linePos5 then yes else no;
def show6         = if linePos6 > linePos5 and barNum == highestBarNum - linePos6 then yes else no;

AddVerticalLine( show1, linePos1+" Agg-bars", GetColor( 0 ) );
AddVerticalLine( show2, linePos2+" Agg-bars", GetColor( 1 ) );
AddVerticalLine( show3, linePos3+" Agg-bars", GetColor( 2 ) );
AddVerticalLine( show4, linePos4+" Agg-bars", GetColor( 3 ) );
AddVerticalLine( show5, linePos5+" Agg-bars", GetColor( 4 ) );
AddVerticalLine( show6, linePos6+" Agg-bars", GetColor( 5 ) );
AddLabel(1, "Vertical lines have been placed at the inputted locations", color.white);
Comment: This is a good example illustrating the use of the Assert function.
C-PLOT BARNUMBERS AT SPECIFIED INTERVALS
Bar-number data and counting can be very useful when debugging code. The script below may be useful.
# Title = Bar_Number_Plot_Interval
#hint: Numbers the bars at inputted intervals. A line plot is also selectable. This may be shown on the upper or lower plot by using 'EDIT STUDIES'.

Input Interval = 5;#hint Interval: Enter the desired interval between shown bar mumbers.\n 0 and 1 plots at every bar.

Input BarNumbLine = Yes;#hint BarNumbLine: YES shows a line plot of bar number at the 'high' price.

def Every_Interval = interval - 1;
plot Data = if BarNumbLine == 1 then high else double.nan;

def barNumber = barNumber();
Plot bn = if (barNumber -1) % Interval == 1 then barNumber else double.nan;

bn.SetPaintingStrategy(PaintingStrategy.VALUES_BELOW);
plot bn_1 = if interval == 0 or interval == 1 then barNumber else double.nan;
bn_1.SetPaintingStrategy(PaintingStrategy.VALUES_BELOW);

#####################
def TotalBars = HighestAll(barNumber());
AddLabel( yes, "TotalBars =  " + TotalBars , Color.white);
AddLabel( yes,  "Numbering Interval = " + Interval, Color.pink);
The above is a study named Bar_Number_Plot_Interval.txt available at http://mytrade.com/StanL
C-BAR COUNT BETWEEN HIGHS & SHOW BAR NUMBERS
#hint: <b>Bar Count Between Highs</b>\n Counts the number of bars between each high in the specified length, default 20.

def barnumber = barnumber();
input length = 20;#hint Length: Looks for new highs within every Agg-bars length. <b>(Default is 20)</b>

input gap_length = 200;#hint gap_length: If there is a large gap between new highs, this gap_length is used to find the previous highest high and it subtracts the current high bar number from the previous high barnumber. <b>\n(Default is 200)</b>

input show_Bar_number = NO;#hint  show_Bar_number:Yes shows each bar number

def numberold1 = if highest(high, length)[1] then barnumber else double.nan;
def signal = if highest(high, length) > highest(high, length)[1] then barnumber() else 0;
def signal1 = if signal > 0 then (signal - highest(signal, length)[1]) else 0;
plot count = if signal1 > 0 and signal1 != barnumber() then signal1 else if signal1 == barnumber() then (signal1 - highest(signal[1], gap_length)) else double.nan;

 count.SetPaintingStrategy(PaintingStrategy.VALUES_ABOVE);
 plot Bar_number = if show_Bar_number == yes then barnumber() else double.nan;
 Bar_Number.setPaintingStrategy(paintingStrategy.VALUES_BELOW);

 ```


=== C-MARKET OPEN AND LUNCH TIMES
def NineThirty = secondsFromTime(930) > 0; def TwelveOclock = secondsFromTime(1200) > 0; def MarketOpen = NineThirty > 0 && NineThirty [1] ⇐ 0; def LunchTime = TwelveOclock > 0 && TwelveOclock[1] ⇐ 0;
AddVerticalLine(MarketOpen or LunchTime,if MarketOpen then "TIME TO TRADE!" else "LUNCH TIME",if MarketOpenthen color.GREEN else color.BLUE);
=== C-SQUEEZE SCAN WITH MACD EXIT#Squeeze Exit / MACD Scan BollingerBandsSMA()."UpperBand" is greater than KeltnerChannels()."Upper_Band" and BollingerBandsSMA()."UpperBand"[1] is less than KeltnerChannels()."Upper_Band"[1] and MACD() > 0 and MACD() > MACD()[1]
=== C-SHOWING WHERE A CANDLE PATTERN  EXISTS


-You can show/plot where any particular candle pattern exists. Below is code that shows where the popular Doji pattern exists:
plot d = Doji();# If a Doji is present Doji() is true.The below lines format what to show at that location.
d.setPaintingStrategy(PaintingStrategy.BOOLEAN_ARROW_UP); d.setLineWeight(2); d.setDefaultColor(Color.White);
You may find this reference on the Doji of value....http://ezinearticles.com/?Candlestick-Charting-and-Reversal-Patterns---The-Doji&id=1068331

Doji() as used above is the simplest of all candles to show because it has only a single plot. But other patterns are more complicated. For example, some candles may be bullish (up) or bearish (down) patterns. As an example on how to substitute them for the Doji() used above, we'll use Harami. When we inspect its code , we see that it has three input variables and two plots named 'bullish' and 'bearish'. In this example, we'll retain all the parameters (assuming that

ThinkScript knows the best parameters to use) and show the 'bullish' plot only. The def condition above now becomes:

`def condition = if (Harami().Bullish , 1, 0); # Whenever Harami().Bullish is present, condition is true`

The remainder of the code statements can be changed to reflect reading correctness but what plots will be unaffected if they are not changed.

-If you want to also change the candle's parameters then the code becomes as follows with you providing values for the ????. The code becomes `def condition = if (Harami(length = ????, trendSetup = ????, bodyFactor = ????).Bullish , 1, 0);`

Note that the parameter names (length, trendSetup and  bodyFactor) are exactly the same as in the Harami code.

-


=== C-VOLUME AS A % OF THE ??-DAY-AVERAGE
#hint:Uses the VolumeAvg study and adds a label showing volume as the percent of the average daily volume. The average daily volume length is based on the variable inputted length.
#Title = VolumeAvg_WithLabel
declare lower; declare zerobase; input length = 50;
plot Vol = volume; plot VolAvg = Average(volume, length); Vol.SetPaintingStrategy(PaintingStrategy.HISTOGRAM); Vol.SetLineWeight(3); Vol.DefineColor("Up", Color.UPTICK); Vol.DefineColor("Down", Color.DOWNTICK); Vol.AssignValueColor(if close > close[1] then Vol.color("Up") else if close < close[1] then Vol.color("Down") else GetColor(1)); VolAvg.SetDefaultColor(GetColor(8));
calc label# #def AggPeriod = getAggregationPeriod();
def Pct_Avg = Volume(period = AggregationPeriod.DAY) / Average(volume(period = AggregationPeriod.DAY), length) * 100;
AddLabel(yes, "Today’s Vol = " + round(Pct_Avg,1) + " % of the " + length + "-day-average" ,color.PINK);
Alternate 1:#Hint: <b>Shows a label of current Volume as a % of the input Period Average Volume</b>\n Colors Label based on current Volume being > or < Average Volume
#Usage: All 'edit studies' check boxes are blank when used as a pure label only. If you want to see the percentage for any bar under your cursor, then: (1) Check the 'show study' box in edit studies; OR (2) Change 'declare upper' to 'declare lower' and check all boxes in 'edit studies'.
declare upper;
input VolAvgLength = 50;#hint VolAvgLength:Insert the base agg-bars volume length def data = (Volume / VolumeAvg(VolAvgLength).VolAvg)-1;#Vol as fraction of VolAvgLength
plot VolPct = 100 * data; VolPct.SetPaintingStrategy(PaintingStrategy.LINE); #VolPct.SetLineWeight(1); #VolPct.SetDefaultColor(Color.PINK); VolPct.hide(); can be over-ridden by the edit-studies check boxes addlabel(yes,"Vol as % of " + VolAvgLength + " agg-bar avg volume = " + aspercent(Round(data,2)),if data < 0 then color.RED else color.GREEN);
Alternate 2:#hint: Plots: 1. The volume histogram; 2. The inputted agg-bar average; and 3. A arrow when the volume exceeds the inputted average with an info label.
declare lower; input length = 10;#hint length:The length of the average volume plot input pct = 25.0;#hint pct:Plots an arrow when volume exceeds the average by this percent def _volAvg = Average( volume, length ); def volTest = volume >= _volAvg * ( 1+ ( pct / 100 ) ); plot Vol = volume; Vol.SetPaintingStrategy( PaintingStrategy.HISTOGRAM ); Vol.SetLineWeight(3); Vol.DefineColor("Up", Color.UPTICK); Vol.DefineColor("Down", Color.DOWNTICK); Vol.AssignValueColor(if close > close[1] then Vol.color("Up") else if close < close[1] then Vol.color("Down") else GetColor(1));
plot VolAvg = _volAvg; VolAvg.SetDefaultColor(GetColor(8)); plot VolAlert = if volTest then volume * 1.30 else Double.NaN; VolAlert.SetPaintingStrategy( PaintingStrategy.ARROW_UP); VolAlert.SetDefaultColor( Color.GREEN ); VolAlert.SetLineWeight(2); Addlabel(yes, "Arrow shows when volume is >= "+ pct + "above the " + length +"-bar-average",color.GREEN);
=== C&S-IDENTIFY CURRENT LOW THAT HAS GAPED UP#Plot or scan for current low that has gaped-up by an input percent
input price1 = low;#hint Price1:The post-gap-up basis input GapPct = 0.5;#Hint GapPct: The gap-up percent input price2 = high;#hint Price2: The prior gap-up-bar-basis input WithinBars = 15;#hint WithinBars:The number of bars-back to evaluate
def x = 1+GapPct/100; # factor for above 100 % def term = x*price2[1]; # = factor * previous high plot scan = price1 >= term;
To scan for above happening within the last 15 days the above would read #plot scan = price1 >= term within WithinBars bars; === below items not needed for a scan # scan.SetpaintingStrategy(paintingStrategy.BOOLEAN_ARROW_up); scan.SetLineWeight(5); scan.SetDefaultColor(Color.White);
=== C&S-PERCENTAGE CHANGE OF AN AVERAGE (SCAN OR PLOT)#Hint:Scan/plot for a increase or decrease % of an inputted Parameter and average-length #The 'Inputted Parameter' has a choice of eleven different parameters #Give an up arrow where true input price = volume;#hint Price:Parameter being measured input choice = {default increase, decrease};#hint Choice: Choose Increase or Decrease % input percent = 20;#hint percent: Enter the percent increse/decrease input length = 50;#hint length: The average length being evaluated def avg = average(price, length)[1]; def chg = 100*(price/avg -1); plot scan; switch (choice) { case increase: scan = chg >= percent; case decrease: scan = chg ⇐ -percent; }
#Below items not needed for a scan # #scan.setpaintingStrategy(paintingStrategy.BOOLEAN_ARROW_DOWN); scan.SetpaintingStrategy(paintingStrategy.BOOLEAN_ARROW_UP); scan.SetLineWeight(5); scan.SetDefaultColor(Color.White); AddLabel(yes,Percent + " % " + Choice + " of the " + length + "-bar-average of a selected input price",color.white);
=== C-ARROW AT THE DEFINED TIME EACH DAY#hint:Places an arrow at the defined time each day
declare hide_on_daily; def barnumber = BarNumber(); input time = 1000;#hint time:Time to place the arrow at
def timeTest = SecondsFromTime(time) == 0; def plotPrice = CompoundValue(1, if timeTest then barnumber else plotPrice[1], barnumber); def data = plotPrice; def a = barnumber - data;
Plot Arrow = If TimeTest then close else double.nan; Arrow.SetPaintingStrategy(PaintingStrategy.BOOLEAN_ARROW_UP); Arrow.SetLineWeight(5); Arrow.SetDefaultColor(Color.White); AddLabel(yes, "Arrow is at time = " + AsPrice(time) +" of each day" ,color.white);
=== C-SHOWS ARROWS WHEN THE PRICE CROSSES THE MOVING AVERAGE#hint: <b>MovingAverage Crossover - Once Per Chart</b>\nThis study shows arrows when the price crosses the moving average. The study by default only shows the latest crossing to free up screen space for more awesome studies.\n Enjoy - Jesse (author on the Mr. Script show)
input price = close;#hint price:Select the price of choice input length = 10;#hint Length:Length of the average input averageType = AverageType.EXPONENTIAL;#hint averageType:Select the type of average desired input MostRecentOnly = Yes;#hint MostRecentOnly: Shows the most recent crossing only. \n <b>(Default is Yes)</b>
def avg = MovingAverage(averageType, price, length); def crossingdown = price crosses below avg; def crossingup = price crosses above avg; def crossingover = close("Greatest Show Ever!"); def barnumber = barnumber(); def count = if crossingdown or crossingup then barnumber else 0;
plot onceperchartup = if MostRecentOnly and crossingUP and count == highestall(count) then low else double.nan;
plot onceperchartdown = if MostRecentOnly and crossingdown and count == highestall(count) then high else double.nan;
onceperchartdown.setPaintingStrategy(paintingStrategy.BOOLEAN_ARROW_down); onceperchartup.setPaintingStrategy(paintingStrategy.BOOLEAN_ARROW_UP); onceperchartup.setDefaultColor(color.light_green); onceperchartdown.setDefaultColor(color.light_red); onceperchartdown.setLineWeight(3); onceperchartup.setLineWeight(3); onceperchartdown.hidetitle(); onceperchartup.hidetitle();
Plot CrossUp = !mostRecentOnly and crossingup; crossup.setPaintingStrategy(paintingStrategy.BOOLEAN_ARROW_UP); crossup.setDefaultColor(color.light_green); crossUp.setLineWeight(3); crossup.hidetitle();
Plot Crossdown = !mostRecentOnly and crossingdown; crossdown.setPaintingStrategy(paintingStrategy.BOOLEAN_ARROW_down); crossdown.setDefaultColor(color.light_red); crossdown.setLineWeight(3); crossdown.hidetitle();
=== C-LINE FROM OPEN OF FIRST BAR OF DAY OR YESTERDAY'S CLOSE#plot a flat line from open of first bar of day. For use on multi-day charts.
def day = getDay(); def firstBar = day != day[1];
AssignPriceColor(if firstBar then color.ORANGE else color.CURRENT); def dayOpen = if firstBar then high else dayOpen[1];
plot x = dayOpen; Alternate 1: Line from/for yesterday’s close
declare upper; def barNum = if IsNaN( close ) then Double.NaN else BarNumber(); def highestBar = HighestAll( barNum ); def previousClose = if barNum == highestBar - 1 then close else Double.NaN; plot CloseLine = HighestAll( previousClose ); CloseLine.SetDefaultColor( Color.gray);
=== C-% CHANGE OF THE FIRST BAR VALUE#Hint:<b> Plots the %-change-of-the-first-bar-value.</b> declare lower; input price = close;#hint price:This is the variable (11 choices) that will be plotted. def close1 = First(price);#Defines the first bar value
plot Data = ( price - close1) / close1 * 100; Plot ZeroLine = 0;
AddLabel(1,"Shown is the %-change-of-the-first-bar-value of " + close1,color.white);
#Puts any of the 11 price choices into a literal text in a label like ohlc4 = 75
AddLabel(yes, if price == close then "The price-variable selected is close = " + Round(close,2) else if price == open then "The price-variable selected is open = " + Round(open,2) else if price == high then "The price-variable selected is high = " + Round(high,2) else if price == low then "The price-variable selected is low = " + Round(low,2) else if price == hl2 then "The price-variable selected is hl2 = " + Round(hl2,2) else if price == hlc3 then "The price-variable selected is hlc3 = " + Round(hlc3,2) else if price == imp_volatility then "The price-variable selected is current imp_volatility = " + AsPercent(imp_volatility) else if price == ohlc4 then "The price-variable selected is ohlc4 = " + Round(ohlc4,2) else if price == open_interest then "The price-variable selected is Open_interest = " + Round(open_interest,0) else if price == volume then "The price-variable selected is Volume = " + Round(volume,0) else if price == VWAP then "The price-variable selected is VWAP = " + Round(VWAP,0) else "N/A",color.white);
=== C-% CHANGE COMPARED TO ? DAYS-AGO#hint:Plots and shows a label for the change compared to the past inputted-number-of-days. declare lower;
input length = 30;#hint length:the number of trading days-ago for the change def price = close(period = AggregationPeriod.day); def Change = (price / price[length] - 1);
Plot PctChange = 100 * change; AddLabel(yes,"% Change compared to " + length + " days ago = " + Round(PctChange, 1) + "%",color.PINK);
```
C-LOW IS ?% ABOVE YESTERDAY’S HIGH
#Plot or scan for current low that is ?% above yesterday's high
#this is run on a 'day' aggregation

input price1 = low;
input percentage = 2.0;
input price2 = high;

def x = 1+percentage/100; # Equals 1.02 = factor for above 100 %
def term = x*price2[1]; #  = 1.02 * previous high

plot scan = price1 >= term;
scan.SetpaintingStrategy(paintingStrategy.BOOLEAN_ARROW_DOWN);
scan.SetLineWeight(5);
scan.SetDefaultColor(Color.White);
C-IMP-VOLATILITY PERCENTILE
# hint: you can also copy/paste this code to create a custom IV percentile column for a watch list

def vol = impVolatility();
def hi = highest(vol,252);#is a one-year-day value. Use 189 for 6-month-day value
def lo = lowest(vol,252);#is a one-year-day value. Use 189 for 6-month-day value
def perct = (vol - lo) / (hi - lo);

AddLabel(1, "IV Percentile + " + AsPercent(perct)+ " of the yearly range", if perct > 0.80
then Color.Green
else if perct < 0.80 and perct > 0.50
then Color.Yellow
else color.Light_Red);
C-YTD PERCENT CHANGE
#Hint:watchlist or label YTD-percent-change

input price = close;#hint price:<b>Must be close for intended value</b>/n An error is in the label if close is not selected

def day = getDay();
def month = getmonth();
def year = getyear();
def lastDay = getLastDay();
def lastmonth = getlastmonth();
def lastyear = getlastyear();
def isToday = if(day == lastDay and month == lastmonth and year== lastyear, 1, 0);
#def yearswitch = if Highest(GetYYYYMMDD(), 300) > 20130000 then 20130102 else 20120103;# this line was in the original version and is replaced by the following

def yearswitch = if highest(getyyyymmdd(), 300) > 20140000 then 20140102 else 20130102;
def yearstart = if getyyyymmdd() == yearswitch then price else 0;
def todayend = if istoday then price else 0;
def jan1 = highest(yearstart, 300);
def now = highest(todayend, 300);
plot "YTD Percent Change" = round((((now - jan1)/ jan1) * 100), 2);
"YTD Percent Change".AssignValueColor(If "YTD Percent Change" > 0 then color.Green else if "YTD Percent Change" < 0 then color.red else color.yellow);

#=== Comment out the next hide code if this is used as a column watchlist #####
"YTD Percent Change".hide();#Plot has nothing of value to see
##=== Comment-out the below label if this is used as a column watchList ####
AddLabel(1,"YTD % Change of the " + if price == close then "close = "+ "YTD Percent Change" + "  else
"'ERROR...WRONG PRICE-VARIABLE SELECTED'"  ,if price == close then color.cyan else color.red);
Alternate = current close as percent of the last-52-week-range
 #Current price as % of 52-week-range
 input price = close;
 def YearHigh = highest(high, 252);
 def YearLow = lowest(low, 252);
 def YPR = round((price – YearLow) / (YearHigh – YearLow) * 100,2);
 addlabel(yes, "Current price as % of 52-week-range = "+ round(YPR,0) + " %" , Color.white);
 # If used as a custom column the below label is appropriate
 #addlabel(yes, concat(YPR, "%"),  if YPR > 75 then color.green else if YPR < 25 then color.red else color.current);
C-PLOT A HORIZONTAL LINE THRU A DEFINED DATE
#hint: <b>Plot a H-line on a date</b>\nPlots a horizontal line at the close on a specified date. Use on a daily chart.

declare hide_on_intraday;
input Date = 20130801;#hint Date: Set the date you want see.<b>\n(Enter in YYYYMMDD)</b>
input price = CLOSE;
input show_line = Yes;#hint show_line: Show a horizontal line at this price<b>(Default is Yes)</b>

def timeTest = getYyyyMmDd() == date;
def data = if timetest then price  else double.nan;

plot Line = if show_line then highestall(data) else double.nan;
line.assignValueColor((if price == close then color.cyan else if price == open then color.pink else if price == low then color.yellow else if price == high then color.green else color.red));

def monthday = if timetest then getdayOfMonth(date) else double.nan;
def month = if timetest then getmonth() else double.nan;

AddChartBubble(timetest, price,
concat(concat(concat("Date: ",Concat(month, "/")), monthday),  concat((if price == close
then "   Close: $" else if price == open then "   Open: $" else if price == low then "   Low: $" else if price == high then "High: $" else "   Value:  "), price)),
(if price == close then color.cyan else if price == open then color.pink else if price == low then color.yellow else if price == high then color.green else color.red)
, yes);
C-ADD AN INDEX OR FUTURE LOWER CHART
The AddChart function is unsupported in TOS, Hence there is no documentation to support its use and color formatting.
Also, not all chart types are supported.
Usage example: You may have a stock plotted on the upper panel:Say an oil company, CVX. You may want to see how its price varies with the oil futures. The code below allows you to show the oil futures (/CL) below for comparison.
declare lower;

input chartType = ChartType.CANDLE;

input Security  =  {default "SPX", "COMP", "DJX", "HUI", "MNX", "SOX", "NDX", "OEX", "QQQQ","QQQ","RUT", "VIX", "VXO", "XAU", "QQV", "TNX","/ES","/CL"};

AddChart( high  = high( Security ),
  low   = low( Security ),
  open  = open( Security ),
  close = close( Security ),
  type  = chartType );

AddLabel(1, if Security == Security."SPX" then "SPX = S&P 500 INDEX is showing"
else if Security == Security."COMP" then " COMP =  NASDAQ COMPOSITE is showing "
else if Security == Security."DJX" then " DJX =  DOW JONES INDUSTRIAL AVERAGE INDEX is showing"
else if Security == Security."HUI" then "HUI =  AMEX GOLD BUGS INDEX  is showing"
else if Security == Security."MNX" then "MNX = CBOE MINI NASDAQ INDEX  is showing"
else if Security == Security."SOX" then "SOX  = PHLX SEMI CONDUCTOR INDEX  is showing"
else if Security == Security."NDX" then " NDX = NASDAQ 100 INDEX INDEX is showing"
else if Security == Security."OEX" then "OEX =  S & P 100 INDEX is showing"
else if Security == Security."RUT" then " RUT = Russel 2000 Index is showing  "
else if Security == Security."QQQ" then "QQQ =  POWERSHARES QQQ is showing"
else if Security == Security."VIX" then "VIX =  CBOE MARKET VOLATILITY INDEX is showing"
else if Security == Security."VXO" then "VXO = CBOE OEX IMPLIED VOLATILITY INDEX is showing"
else if Security == Security."XAU" then " XAU = GOLD & SILVER INDEX is showing"
else if Security == Security."QQV" then "QQV =  QQQQ VOLATILITY INDEX is showing"
else if Security == Security."TNX" then " TNX =  10-YR TREASURY INDEX is showing"
else if Security == Security."/CL" then "/CL =  Light Sweet Crude Oil Futures is showing"
else if Security == Security."/ES" then "/ES = E-mini S&P 500 Index Futures is showing"
else  "ERROR – none were found", Color.WHITE);
C-LINE RSI WITH MACD HISTOGRAM
An RSI indicator on a single line with over-bought/over-sold color indication. This RSI is in conjunction with a MACD
declare lower;
input RSI_Wilder_length = 14;
input RSI_Wilder_over_bought = 70;
input RSI_Wilder_over_sold = 30;
input RSI_Wilder_price_type = close;
def RSIplot = RSIWilder(RSI_Wilder_length, RSI_Wilder_over_bought, RSI_Wilder_over_sold,
RSI_Wilder_price_type);
plot RSI_line = 0;
RSI_line.SetPaintingStrategy(PaintingStrategy.POINTS);
RSI_line.AssignValueColor(if RSIplot >= RSI_Wilder_over_bought then Color.RED else if RSIplot <=
RSI_Wilder_over_sold then Color.GREEN else Color.YELLOW);
#######################
=== MACD HISTOGRAM PLOT#####
#######################
input MACD_Histogram_fastLength = 12;
input MACD_Histogram_slowLength = 26;
input MACD_Histogram_MACDLength = 9;
input MACD_Histogram_AverageType = {SMA, default EMA};

plot Diff = MACD(MACD_Histogram_fastLength, MACD_Histogram_slowLength, MACD_Histogram_MACDLength,

MACD_Histogram_AverageType).Diff;
Diff.SetDefaultColor(GetColor(5));
Diff.SetPaintingStrategy(PaintingStrategy.HISTOGRAM);
Diff.SetLineWeight(3);
Diff.DefineColor("Positive and Up", Color.GREEN);
Diff.DefineColor("Positive and Down", Color.DARK_GREEN);
Diff.DefineColor("Negative and Down", Color.RED);
Diff.DefineColor("Negative and Up", Color.DARK_RED);
Diff.AssignValueColor(if Diff >= 0 then if Diff > Diff[1] then Diff.color("Positive and Up") se Diff.color("Positive and
Down") else if Diff < Diff[1] then Diff.color("Negative and Down") else Diff.color("Negative d Up"));
AddLabel(yes, if RSIplot >= RSI_Wilder_over_bought then "RSI on the line is Overbought" else if Iplot <=
RSI_Wilder_over_sold then "RSI on the line is Oversold" else "RSI on the line is Neutral",if Iplot >=
RSI_Wilder_over_bought then Color.RED else if RSIplot <= RSI_Wilder_over_sold then Color.GREEN se
Color.YELLOW);
C-MARKET SENTIMENT
#hint: <b>Market Sentiment</b>\nThe Market Sentiment study is a popular study in Prophet Charts.
declare lower;
input perioda = 51;
input periodb = 47;
input RoundingValue = 4;
def llow = Lowest(low, perioda);
def c_ln = close - llow;
def hhigh = Highest(high, perioda);
def hn_ln = hhigh - llow;
def numerator = Sum(c_ln, periodb);
def denominator = Sum(hn_ln, perioda);
plot MarketSentiment = round(100* (numerator/denominator), RoundingValue);
marketsentiment.setDefaultColor(color.yellow);
C-MARKET FORECAST PLOTTED BY REFERENCE
Comment: This illustrates how to plot a study (MarketForecast) by reference.
declare lower;
plot x = MarketForecast();#Momentum is the default plot: The first listed in the study code.
plot y = MarketForecast().NearTerm;
plot z = MarketForecast().Intermediate;
plot HighValue = 80;
plot LowValue = 20;
x.setdefaultColor(color.green);
addlabel(1,"Market Forecast Momentum",color.green);
addlabel(1,"Market Forecast NearTerm",color.pink);
addlabel(1,"Market Forecast Intermediate",color.white);
C-TRIPLE EMA & STD DEV MONITORING
#by Mr. Script. Formatting added by SFL.
#Triple EMA &  Std Dev monitoring
#start code
declare lower;
input bperiod = 18;
input TEMAavg = 8;
input std_dev_up = 1.5;
input std_dev_down = -1.5;
input stdev_length = 63;
def haopen = CompoundValue(1, ((open[1] + high[1] + low[1] + close[1]) / 4 + haopen[1]) / 2, hl2);

def haclose = ((open + high + low + close) / 4 + haopen + Max(high, haopen) + Min(low, haopen)) / 4;

def TMA1 = TEMA(haclose, TEMAavg);
def TMA2 = TEMA(TMA1, TEMAavg);
def Diff = TMA1 - TMA2;
def ZIHA = TMA1 + Diff;
plot percB =  (TEMA(ZIHA, TEMAavg) + 2 * StDev(TEMA(ZIHA, TEMAavg), bperiod) - WMA(TEMA(ZIHA, TEMAavg), bperiod)) / (4 * StDev(TEMA(ZIHA, TEMAavg), bperiod)) * 100;

#.SetPaintingStrategy(PaintingStrategy.BOOLEAN_ARROW_UP);
percB.SetLineWeight(1);
percB.SetDefaultColor(Color.cyan);

plot overbought = 50 + std_dev_up * stdev(percB, stdev_length);
overbought.SetLineWeight(1);
overbought.SetDefaultColor(Color.red);

plot oversold = 50 + std_dev_down * stdev(percB, stdev_length);
oversold.SetLineWeight(1);
oversold.SetDefaultColor(Color.red);

plot midline = 50;
Addlabel(1,"RED = overbought/oversold lines", color.light_red);
Addlabel(1,"Above mid-line is bullish. Below is bearish.", color.cyan);
C-FAST-MED-SLOW TRUE RANGE OSC
#by Pacodeveux in Mr. Script show
#Fast, med, slow true range osc
declare lower;
input fastLength = 7;
input medLength = 14;
input slowLength = 28;
input FactorFast = 4;
input FactorMed = 2;
input FactorSlow = 1;

def trRng = TrueRange(high, close, low);
def trRngFast = sum(trRng, fastLength);
def trRngMed = sum(trRng, medLength);
def trRngSlow = sum(trRng, slowLength);
def diff = close - Min(close[1], low);
def diffFast = sum(diff, fastLength);
def diffMed = sum(diff, medLength);
def diffSlow = sum(diff, slowLength);
def valFast = (diffFast / trRngFast) * factorFast;
def valMed = (diffMed / trRngMed) * factorMed;
def valSlow = (diffSlow / trRngSlow) * FactorSlow;

Plot midLine = 0.5;
midLine.SetLineWeight(2);
midLine.SetDefaultColor(Color.yellow);

plot UltOsc = if trRngFast == 0 or trRngMed == 0 or trRngSlow == 0 then 0
else (valFast + valMed + valSlow) / (factorFast + factorMed + 1);
UltOsc.SetDefaultColor(GetColor(1));

AddLabel(1,”Fast-Med-Slow True Range Oscillator”, color.white);
C-CHANGE STUDIES BASED ON SYMBOL VIEWED
#by Mr. Script:
#Change studies based on symbol viewed
input symbol_1 = "SPY";
input symbol_2 = "DIA";
input symbol_3 = "IWM";
input symbol_4 = "AMTD";

plot x;
plot y;
plot z;

if (GetUnderlyingSymbol() == symbol_1)
{
  x = LinearRegChVar("width of channel" = 25.0, "full range" = No, length = 50).UpperLR;
  y = LinearRegChVar("width of channel" = 25.0, "full range" = No, length = 50);
  z = LinearRegChVar("width of channel" = 25.0, "full range" = No, length = 50).LowerLR;
}
else if (GetUnderlyingSymbol() == symbol_2)
{
  x = BollingerBandsSMA().UpperBand;
  y = BollingerBandsSMA();
  z = BollingerBandsSMA().LowerBand;
}
else if (GetUnderlyingSymbol() == symbol_3)
{
  x = close + 5;
  y = hlc3;
  z = close - 5;
}
else if (GetUnderlyingSymbol() == symbol_4)
{
  x = SimpleMovingAvg(length = 50);
  y = SimpleMovingAvg(length = 200);
  Z = PPS().BuySignal;
}
else
{
  x = double.nan;
  y = double.nan;
  z = double.nan;
}
C-PLOTS HIGHER-HIGHS AND LOWER-LOWS
#Hint: Plots consecutive (defined by number)  higher-highs AND lower-lows

input price = close;
input number = 3;#hint number: Arrows are plotted after this number of consecutives are observed

def hi = high;
def lo = low;
def higher = if hi > hi[1] then hi else higher[1];
def lower = if lo < lo[1] then lo else lower[1];

plot h = higher;
h.SetLineWeight(1);
h.SetDefaultColor(Color.cyan);
plot l =lower;
l.SetLineWeight(1);
l.SetDefaultColor(Color.pink);

def hig = higher > higher[1];
def lowe = lower < lower[1];

plot x = sum(hig,number) >= number;
x.setPaintingStrategy(paintingStrategy.BOOLEAN_ARROW_DOWN);
x.SetLineWeight(1);
x.SetDefaultColor(Color.White);

plot y = sum(lowe,number) >= number;
y.setPaintingStrategy(paintingStrategy.BOOLEAN_ARROW_UP);
y.SetLineWeight(1);
y.SetDefaultColor(Color.yellow);

AddLabel(1,"Plot of highs", color.cyan);
AddLabel(1,"Plot of lows", color.pink);
AddLabel(1,"Plot arrows of higher-highs", color.white);
AddLabel(1,"Plot arrows of lower-lows", color.yellow);
C-CANDLESTICK PLOTS
If you are interested in seeing examples of various candlesticks, there are two studies available. They are: (1) Bearish candle plots.txt; and (2) Bullish candle plots.txt. They are too big to include here but may be downloaded from http://mytrade.com/StanL There are many examples of coding procedures within those files. They are also excellent for correlating the looks of a candle with its title.
C-ATR TRAILING STOP
Trailing Stop By Jesse on the Mr. Script show
input trailType = {default modified, unmodified};
input ATRPeriod = 5;
input ATRFactor = 3.5;
input firstTrade = {default long, short};

assert(ATRFactor > 0, "'atr factor' must be positive: " + ATRFactor);

def HiLo = Min(high - low, 1.5 * Average(high - low, ATRPeriod));
def HRef = if low <= high[1]
  then high - close[1]
  else (high - close[1]) - 0.5 * (low - high[1]);
def LRef = if high >= low[1]
  then close[1] - low
  else (close[1] - low) - 0.5 * (low[1] - high);
def ATRMod = ExpAverage(Max(HiLo, Max(HRef, LRef)), 2 * ATRPeriod - 1);
def loss;
switch (trailType) {
  case modified:
    loss = ATRFactor * ATRMod;
  case unmodified:
    loss = ATRFactor * AvgTrueRange(high, close, low, ATRPeriod);
}

def state = {default init, long, short};
def trail;

switch (state[1]) {
  case init:
    if (!IsNaN(loss)) {
      switch (firstTrade) {
        case long:
          state = state.long;
          trail =  close - loss;
        case short:
          state = state.short;
          trail = close + loss;
      }
    } else {
      state = state.init;
      trail = Double.NaN;
    }

  case long:
    if (close > trail[1]) {
      state = state.long;
      trail = Max(trail[1], close - loss);
    } else {
      state = state.short;
      trail = close + loss;
    }
  case short:
    if (close < trail[1]) {
      state = state.short;
      trail = Min(trail[1], close + loss);
    } else {
      state = state.long;
      trail =  close - loss;
    }
}

def BuySignal = Crosses(state == state.long, 0, CrossingDirection.Above);
def SellSignal = Crosses(state == state.short, 0, CrossingDirection.Above);

plot TrailingStop = trail;
TrailingStop.SetPaintingStrategy(PaintingStrategy.POINTS);
TrailingStop.DefineColor("Buy", GetColor(0));
TrailingStop.DefineColor("Sell", GetColor(1));
TrailingStop.AssignValueColor(if state == state.long
  then TrailingStop.color("Sell")
  else TrailingStop.color("Buy"));

plot cross = close crosses trailingstop;
cross.setPaintingStrategy(paintingStrategy.BOOLEAN_ARROW_DOWN);
C&S-EARNINGS
On Earnings by Jesse on Mr Script show
#The move after earnings
declare lower;

plot EstEarning = getEstimatedEarnings();
EstEarning.SetPaintingStrategy(PaintingStrategy.POINTS);
plot actual_earnings= getactualearnings();

actual_earnings.setpaintingstrategy(paintingstrategy.points);

def c = if actual_earnings then getyyyymmdd() else double.nan;
def d = c + 1;
def e = if c then close(period = aggregationperiod.day) else double.nan;
def f = if d then open(period = aggregationperiod.day)[-1] else double.nan;

plot "Move after earnings" = f - e;
"Move after earnings".setpaintingstrategy(paintingstrategy.points);

###########################
#The below is how to scan for earnings
Input length = 10;#hint length: The days to scan for
def a = hasearnings();
def b = getday();
def c = if a then b else 0;
def d = average(c, length);
def e =  d[-length];
plot f = e > 0;
C-SLOPE OF AN AVERAGE + 'AVERAGE TYPE' USAGE IN A LABEL
#hint:Plots the tangent angle of the inputted average
declare lower;
input length = 9;#hint length:The number agg-bars of the average
input price = close;#hint Price:The price choice being evaluated
input averageType = AverageType.EXPONENTIAL;#hint averageType:Select the average type desired

def avg = MovingAverage(averageType, price, length);
def height = avg - avg[length];

plot "Angle, deg" = ATan(height / length) * 180 / Double.Pi;
"Angle, deg".AssignValueColor(if "Angle, deg" >= 0 then Color.green else Color.red);
plot xavg = avg;
plot xheight = height;
plot ZeroLine = 0;

addlabel(1,"Plot is the tangent angle of the " + length + "-bar " + If averageType == AverageType.EXPONENTIAL then "Exponential average"
else if  averageType == AverageType.Hull then "Hull average"
else if averageType == AverageType.simple then "Simple average"
else if averageType == AverageType.wilders then "Wilders average"
else if averageType == AverageType.weighted then "Weighted average"
else "" ,color.white);
Comment: In the label, note the retrieval of the literal AverageType selection. The code shown is very reusable.
Comment2: This plot follows a trend very well
C-TODAY’S MARKET OPENING PRICE
#by Mobius©:
#hint: Plots a horizontal line at a value of today's market opening price

input CashOpen = 0930;
input Settlement = 1615;

def Today = GetDay() == GetLastDay();
def TodaysOpen = if SecondsFromTime(CashOpen) == 0 and
SecondsTillTime(Settlement) >= 24300 and Today
  then open else TodaysOpen[1];

plot DaysOpen = if TodaysOpen then TodaysOpen else Double.NaN;
DaysOpen.SetPaintingStrategy(PaintingStrategy.DASHES);
DaysOpen.SetDefaultColor(Color.WHITE);
C-PLACING OF PLOTTED ARROWS
When you want to move a plotted arrow you can place it with the 'values_above' or 'values_below' painting strategy constants. See:
Another method has been used that plots a value and assigns an arrow to it with 'SetPaintingStrategy'. An example follows:
put spacer= 3;
ot arrowdn= if BarNumber() == SundayBar and SundayOpen < FridayClose then high+ticksize()pacer else double.nan;
ArrowDn.SetPaintingStrategy(PaintingStrategy.Arrow_Down);
ArrowDn.SetLineWeight(3);
ArrowDn.SetDefaultColor(Color.Red);
C-SPECIFYING 'AVERAGETYPE' INPUT
input AverageType = {default Simple, Exponential, Weighted, Wilders, Hull};
To specify an individual selection use, as an example, AverageType == AverageType.Weighted Example:
input averageType1 = {default Simple, Exponential, Weighted, Wilders, Hull};
input length1 = 10;
def price = close;
plot MovAvg1 = MovingAverage(averageType1, price, length1);
C-ORDER BASED ON DIFFERENCE OF 3 MOVING AVERAGES
#hint:Order based on value difference of three averages
input averageType1 = {default Simple, Exponential, Weighted, Wilders, Hull};
input averageType2 = {default Simple, Exponential, Weighted, Wilders, Hull};
input averageType3 = {default Simple, Exponential, Weighted, Wilders, Hull};
input length1 = 10;
input length2 = 46;
input length3 = 230;
input val_diff = .05;

def price = close;
plot MovAvg1 = MovingAverage(averageType1,price, length1);
plot MovAvg2 = MovingAverage(averageType2,price, length1);
plot MovAvg3 = MovingAverage(averageType3,price, length1);
plot condition = absValue(MovAvg1 - MovAvg2) <= val_diff AND absValue(MovAvg1 - MovAvg3) <= val_diff AND  absValue(MovAvg2 - MovAvg3) <= val_diff;
condition.setPaintingStrategy(paintingStrategy.BOOLEAN_ARROW_UP);

addOrder(OrderType.BUY_AUTO, condition);
addOrder(type = OrderType.SELL_TO_CLOSE,!condition);
C- DEFINING CONDITIONS IN BUY/SELL STRATEGY
 #Defining conditions in buy/sell strategy
 def mcd = MACD();
 def price = close;
 def condition1 = mcd > mcd[1] AND average(price,20) > price;
 def condition2 = price < price[1] AND price[1]< price[2];
 def condition3 =  condition1 AND condition2;
 def condition4 = !condition2 and !condition1;

 addOrder(OrderType.BUY_AUTO, condition3);
 addOrder(OrderType.SELL_TO_CLOSE,condition4);

 ```


=== C-THE 'AdvanceDecline' STUDY OF THE NYSE, NASDAQ, AMEX
Comment: This is the built-in 'AdvanceDecline' study. It is duplicated here because it demonstrates so well the selection of various choices and because it is so popular for viewing the market conditions. There is a lot to learn by studying this script. Even the label coding is neat. The bottom label was added to the built-in for clarity. declare lower; input type = {default "Advance/Decline Line", "Advance/Decline Line (Breadth)", "Advance/Decline Line (Daily)", "Advance/Decline Ratio", "Advance/Decline Spread (Issues)", "Absolute Breadth Index"};
input exchange = {default NYSE, NASDAQ, AMEX};
def advances; def declines;
switch (exchange) { case NYSE: advances = close("$ADVN"); declines = close("$DECN"); case NASDAQ: advances = close("$ADVN/Q"); declines = close("$DECN/Q"); case AMEX: advances = close("$ADVA"); declines = close("$DECA"); }
def advnDecl; def level;
switch (type){ case "Advance/Decline Line": advnDecl = advnDecl[1] + if !IsNaN(advances - declines) then advances - declines else 0; level = 0; case "Advance/Decline Line (Breadth)": advnDecl = advances / (advances + declines); level = 0.5; case "Advance/Decline Line (Daily)": advnDecl = (advances - declines) / (advances + declines); level = 0; case "Advance/Decline Ratio": advnDecl = advances / declines; level = 1; case "Advance/Decline Spread (Issues)": advnDecl = advances - declines; level = 0; case "Absolute Breadth Index": advnDecl = AbsValue(advances - declines); level = 0; }
plot AD = if !IsNaN(close) then advnDecl else Double.NaN; plot LevelLine = level; AD.DefineColor("Up", Color.UPTICK); AD.DefineColor("Down", Color.DOWNTICK); AD.AssignValueColor(if advnDecl > advnDecl[1] then AD.color("Up") else AD.color("Down")); LevelLine.SetDefaultColor(GetColor(7)); AddLabel(type == type."Advance/Decline Ratio", (if advances > declines then round(advances / declines, 2) else round(- declines / advances, 2)) + ":1 Ratio");
AddLabel(yes, "Showing is the " + (if type == type."Advance/Decline Line" then "Advance/Decline Line"
else if type == type."Advance/Decline Line (Breadth)" then "Advance/Decline Line (Breadth)"
else if type == type."Advance/Decline Line (Daily)" then "Advance/Decline Line (Daily)"
else if type == type."Advance/Decline Ratio" then "Advance/Decline Ratio"
else if type == type."Advance/Decline Spread (Issues)" then "Advance/Decline Spread (Issues)"
else if type == type."Absolute Breadth Index" then "Absolute Breadth Index"
else "") + " for the "
(if exchange == exchange.NYSE then "NYSE"
else if exchange == exchange.NASDAQ then "NASDAQ"
else if exchange == exchange.AMEX then "AMEX"
else ""), color.white);
#Comment: Each 'if…then…else' statement should be within parentheses to insure printing.
=== C-PLOT FOR ? DAYS FROM A DATE#Hint: Plot for ? calendar (not trading) days from an inputted date\n This works only on a lower plot and <b>not for HA and EquiVolume charts.</b>
Input DaysToPlot = 20;#hint DaysToPlot: the number of calendar days to plot. Input Price = Close; input BeginDate =20130810;#hint BeginDate: The start date in YYYYMMDD format
plot Days = if DaysFromDate(BeginDate) >= 0 and DaysFromDate(BeginDate) ⇐ DaysToPlot then Price else double.NaN;
AddLabel(1, "If you do not see a plot, check if the chart timeframe cover the input date", Color.WHITE);
=== C- PLOT THE CURRENT PRICE ACROSS AN ENTIRE CHART#plots the current price across an entire chart….. a true snippet
input price = close;
plot price_across_chart = HighestAll(if !IsNaN(price) and IsNaN(price[-1]) then price else Double.NaN);
=== C-% VOLUME CHANGE FROM THE PREVIOUS BAR#hint:Shows the percentage volume change from the previous bar
declare lower;
input ShowBubble = No;#hint ShowBubble:Yes shows the over-reference-% bubble input Ref_val = 25;#hint Ref_val:The reference percent
def Vol_Change =((volume / volume[1]) -1) * 100;
plot Ratio_vol = Vol_Change; Ratio_vol.SetPaintingStrategy(PaintingStrategy.HISTOGRAM); Ratio_vol.AssignValueColor(if Ratio_vol >= Ref_val then Color.green else if Ratio_vol < Ref_val and Ratio_vol > 0 then
Color.Light_green else Color.Light_red); Ratio_vol.SetLineWeight(5); Ratio_vol.HideBubble(); plot RefLine = Ref_val; RefLine.SetDefaultColor(Color.Yellow); RefLine.SetLineWeight(2); AddChartBubble(ShowBubble && Vol_Change > Ref_val, Ratio_vol, round(Ratio_vol,0) + "%", Color.green);
addLabel(1,"Shows the % change in volume compared to the previous bar", Color.pink); addLabel(1,"Yellow line = " + Ref_val + "% reference line" , Color.yellow); addLabel(!ShowBubble,"%-value-bubbles available when above " + Ref_val + "% reference line", Color.white); addLabel(ShowBubble,"Bubble percent shown when above the " + Ref_val + "% reference line" , Color.Green);
=== C-INTRADAY CURRENT PRICE CLOUD ATOP DAY'S HIGHEST CLOUD#Hint:For intraday values, plots the days highest cloud and overlays the current price cloud
declare lower;
input IntraDay = Yes;#Hint IntraDay:Yes for intraday only input price = high;#hint Price:Pick the price option desired.\nHigh is the default.\nOpen_Interest and Imp_Volatility are not valid choices.
input Mkt_Start = 0930;#hint Mkt_Start:Show market start time e.g. 930 input Mkt_End = 1600;#hint Mkt_End:Show market end time e.g. 1600
def Past_Mkt_Start = IfSecondsTillTime(Mkt_Start) > 0), 0, 1); def Past_Mkt_End = If((SecondsTillTime(Mkt_End) > 0), 0, 1); def MktIsOpen = If(Past_Mkt_Start and !Past_Mkt_End, 1, 0); def day = GetDay(); def lastDay = GetLastDay(); def Today = If(day == lastDay, 1, 0); def Show = If(IntraDay and Today, 1, If(!IntraDay, 1, 0; def Bar1 = If (day[1] != day, day - 1, 0); def HighestHigh = If(price > HighestHigh[1] and MktIsOpen, price, If(MktIsOpen and !Bar1, HighestHigh[1], price)); def LowestLow = If(price < LowestLow[1] and MktIsOpen, price, If(MktIsOpen and LowestLow[1] > 0 and !Bar1, LowestLow[1], price));
def Highest_High = If(MktIsOpen and Show, HighestHigh, Double.NaN); def Lowest_Low = If(MktIsOpen and Show, LowestLow, Double.NaN);
plot HH_LL_Pct = ((Highest_High / Lowest_Low) - 1) * 100; HH_LL_Pct.SetDefaultColor(Color.GREEN); plot Lower = 0; Lower.HideBubble(); Lower.HideTitle();
plot CurrentPrice = ((price / Lowest_Low) - 1) * 100;
AddCloud(HH_LL_Pct, CurrentPrice, Color.GREEN); AddCloud(CurrentPrice, Lower, Color.WHITE); AddLabel(1, "Green is HH cloud", Color.GREEN); AddLabel(1, "Lower cloud is price choice", Color.VIOLET); AddLabel(1, "Input price choice = " + (if price == close then "close" else if price == open then "open" else if price == high then "high" else if price == low then "low" else if price == hl2 then "hl2" else if price == hlc3 then "hlc3" else if price == IMP_VOLATILITY then "imp_volatility is not a valid choice" else if price == ohlc4 then "ohlc4" else if price == open_interest then "Open_interest is not a valid choice" else if price == volume then "Volume" else if price == vwap then "VWAP" else "ERROR"), Color.WHITE);
##


=== C-PLOT DUAL MOVING AVERAGES
#hint:<b>Moving Averages</b>\nShows the ??-DAY and a ???-DAY moving averages on your intraday and day charts.
declare upper; input price = close;#hint price:Select the price choice input MA1_length = 50;#hint MA1_length:Input a MA1 length input MA2_length = 200;#hint MA2_length:Input a MA2 length Input ShowBubbles = yes;
def MovAvg50 = Average(close (period = "Day"), MA1_length); plot MA50 = MovAvg50; MA50.SetDefaultColor(Color.ORANGE); AddChartBubble(Isnan(Close[-1]) && ShowBubbles, MovAvg50,(MA1_length + "-Day MA"), Color.YELLOW);
def MovAvg200 = Average(close (period = "Day"), MA2_length); plot MA200= MovAvg200; MA200.SetDefaultColor(Color.DARK_ORANGE); AddChartBubble(Isnan(Close[-1]) && ShowBubbles, MovAvg200, (MA2_length + "-Day MA"), Color.DARK_ORANGE);
addLabel(1,"Mov Avg input price choice = " + (if price == close then "close"
else if price == open then "open"
else if price == high then "high"
else if price == low then "low"
else if price == hl2 then "hl2"
else if price == hlc3 then "hlc3"
else if price == imp_volatility then "imp_volatility"
else if price == ohlc4 then "ohlc4"
else if price == open_interest then "Open_interest"
else if price == volume then "Volume"
else if price == VWAP then "VWAP"
else "ERROR"),color.white);
`
#
Comment: A more complex study that allows all five moving average types for all nine price choices is available but is too ong (245 lines) for inclusion here. This is the abridged version using a simple moving average for the nine price choices.
C-SIMPLE MOVING AVERAGE CROSS TRADING
Comment: The effectiveness of this system has not been verified. It is included here for its presentation value.
#BreakPointTrades.com Mechanical System
#Trade the crossovers on a 15 minute chart (daily buy/sell, exit on close system).
#SRS - 9/39 EMA
#SKF - 29/86 EMA (so change EMALength1 to 29, EMALength2 to 86 on a 5 min chart)

declare upper;
input price = close;
input displace = 0;
input EMALength1 = 9;
input EMALength2 = 39;

plot upper = ExpAverage(data = price[-displace], length = EMALength1);
upper.SetDefaultColor(Color.RED);

plot lower = ExpAverage(data = price[-displace], length = EMALength2);
lower.SetDefaultColor(Color.BLUE);

AddCloud(upper,lower);
C-A VERSATILE ROBUST MOVING AVERAGE CROSS STUDY
#hint: <b>Find Moving Average Xover</b>\nFinds when a fast moving average crosses over or under a slow.\n The fast average going above the slow average (bullish crossover) is a signal to buy, while the opposite situation (bearish crossover) is a signal to sell.

input price = close;#hint price: The price used to calculate the crossover. <b>(Default is CLOSE)</b>
input fastLength = 3;#hint fastLength: The number of bars used to calculate the fast moving average. <b>(Default is 3)</b>
input slowLength = 8;#hint slowLength: The number of bars used to calculate the slow moving average. <b>(Default is 8)</b>
input slowAvgType = {default Simple, Exponential, Weighted, Wilders, Hull};#hint slowAvgType: Type of the fast moving average to be used for calculation. <b>(Default is Expontential)</b>
input fastAvgType = {default Simple, Exponential, Weighted, Wilders, Hull};#hint fastAvgType: Type of the fast moving average to be used for calculation. <b>(Default is Exponential)</b>
Input DoArrows = no;#hint DoArrows:Yes shows arrows to define crosses
Input DoPlots = yes;#hint DoPlots: Yes shows MA plots to define crosses. Default is 'YES'
Input DoAlerts = No;#hint DoAlerts:No turns off alerts

Assert( fastLength < slowLength, "fastLength ["+fastLength+"] must be less than slowLength["+slowLength+"]");

def fastAvg;
switch (slowAvgType) {
  case Simple:
    fastAvg = Average(price, fastLength);
  case Exponential:
    fastAvg = ExpAverage(price, fastLength);
  case Weighted:
    fastAvg = wma(price, fastLength);
  case Wilders:
    fastAvg = WildersAverage(price, fastLength);
  case Hull:
    fastAvg = HullMovingAvg(price, fastLength);
}

def slowAvg;
switch (fastAvgType) {
  case Simple:
    slowAvg = Average(price, slowLength);
  case Exponential:
    slowAvg = ExpAverage(price, slowLength);
  case Weighted:
    slowAvg = wma(price, slowLength);
  case Wilders:
    slowAvg = WildersAverage(price, slowLength);
  case Hull:
    slowAvg = HullMovingAvg(price, slowLength);
}

plot signalXup = If DoArrows Then crosses(fastAvg, slowAvg, CrossingDirection.above) else Double.nan;

signalXup.SetDefaultColor(Color.pink);
signalXup.SetPaintingStrategy(PaintingStrategy.BOOLEAN_ARROW_UP);
signalXup.SetLineWeight(3);
plot signalXdn =  If DoArrows Then crosses(fastAvg, slowAvg, CrossingDirection.below) else Double.nan;

signalXdn.SetDefaultColor(Color.Green);
signalXdn.SetPaintingStrategy(PaintingStrategy.BOOLEAN_ARROW_DOWN);
signalXdn.SetLineWeight(3);

Alert(signalXup && DoAlerts, "UP...Fast MA Cross Above Slow MA", Alert.BAR, Sound.Ring );
Alert(signalXdn && DoAlerts, "Down...Fast Ma Cross Below Slow MA", Alert.BAR, Sound.Bell );

Plot fast_Avg = If DoPlots  then Fastavg else double.nan;
fast_Avg.SetDefaultColor(Color.pink);
fast_Avg.SetPaintingStrategy(PaintingStrategy.line);
fast_Avg.SetLineWeight(2);

Plot Slo_Avg = If DoPlots  then Slowavg else double.nan;
Slo_Avg.SetDefaultColor(Color.cyan);
Slo_Avg.SetPaintingStrategy(PaintingStrategy.line);
Slo_Avg.SetLineWeight(2);

AddCloud(fastAvg, slowAvg, color.green, color.red);
AddLabel(1, "Fast MA(" + fastLength + ")",color.pink);
AddLabel(1, "Slow MA(" + slowLength + ")",color.cyan);
C-AVOIDING FALSE SIGNALS
Situation: "I want to find the best time to enter and exit an order. EMA’s are great but so many times a fast line will cross a slow line but then turn right around and un-cross. I want a way to keep from entering and exiting orders to often.
It seems like whenever the fast EMA crosses the slow EMA AND a certain amount of time passes the combination of those 3 events signals a longer term trend. When I say "long" I mean like half a day for day trading"
Solution: Here’s a study for you. The indicator stays 'red' after the Moving Averages cross. When it turns green you are in the safe zone. This is great for true mechanical systems to make sure you don’t enter and exit on false signals.
input price = close;
input Shorter_Time = 10;
input Longer_Time = 21;
Def difference = average(data = price[1], length = Longer_Time) - average(data = price[1], length = Shorter_Time);

plot timer = price[1];
timer.AssignValueColor(if difference < 0 then Color.UPTICK
  else
    if difference >= 0 then
      Color.DOWNTICK
    else
      GetColor(1)
    );
C-USING THE SETHIDING FUNCTION
#hint:This illustrates the use of the SetHiding function. which controls visibility of a plot depending on a condition. If this condition is true, the plot is hidden; otherwise the plot is visible.

input offset = 1 ;# Used to position the plot this amount above the high

plot EachBar = if close < close[1] && close[1] < close[2] then high + offset else double.NaN;
EachBar.SetPaintingStrategy(paintingStrategy.POINTS);
EachBar.SetDefaultColor(color.LIGHT_GREEN);
EachBar.SetLineWeight(5);
EachBar.setHiding(if(close > reference SimpleMovingAvg(length = 21),1,0));
Plot MA = SimpleMovingAvg(length=21);
Comment: The above plots a light_green point (dot) whenever there are two consecutive lower closes. However,EachBar.setHiding… hides that point when it’s condition is true i.e. the close > SimpleMovingAvg(21).
C-MOVING AVERAGE SPECTRUM
#hint:<b>Moving Average Spectrum</b>\nPlots MAs (close) from lengths of 2 to 54 in increments of 2. Colors range from red/yellows, thru blues to magenta/pink respectively.\nSquashing of the colors indicate MAs are getting ready to cross and change direction.\n Consistent spacing of the lines indicate a pattern in place and maintaing the trend.

declare upper;

input L1 = 2;input L2 = 4;input L3 = 6;input L4 = 8;input L5 = 10;input L6 = 12;input L7 = 14;input L8 = 16;input L9 = 18;
input L10 = 20;input L11 = 22;input L12 = 24;input L13 = 26;input L14 = 28;input L15 = 30;input L16 = 32;input L17 = 34;
input L18 = 36;input L19 = 38;input L20 = 40;input L21 = 42;input L22 = 44;input L23 = 46;input L24 = 48;input L25 = 50;
input L26 = 52;input L27 = 54;

plot A1 = Average(close, L1);plot A2 = Average(close, L2);plot A3 = Average(close, L3);plot A4 = Average(close, L4);
plot A5 = Average(close, L5);plot A6 = Average(close, L6);plot A7 = Average(close, L7);plot A8 = Average(close, L8);
plot A9 = Average(close, L9);plot A10 = Average(close, L10);plot A11 = Average(close, L11);plot A12 = Average(close, L12);

plot A13 = Average(close, L13);plot A14 = Average(close, L14);plot A15 = Average(close, L15);
plot A16 = Average(close, L16);plot A17 = Average(close, L17);plot A18 = Average(close, L18);
plot A19 = Average(close, L19);plot A20 = Average(close, L20);plot A21 = Average(close, L21);
plot A22 = Average(close, L22);plot A23 = Average(close, L23);plot A24 = Average(close, L24);
plot A25 = Average(close, L25);plot A26 = Average(close, L26);plot A27 = Average(close, L27);

A1.SetDefaultColor(Color.RED);A2.SetDefaultColor(Color.RED);A3.SetDefaultColor(Color.RED);
A4.SetDefaultColor(Color.ORANGE);A5.SetDefaultColor(Color.ORANGE);A6.SetDefaultColor(Color.ORANGE);
A7.SetDefaultColor(Color.YELLOW);A8.SetDefaultColor(Color.YELLOW);A9.SetDefaultColor(Color.YELLOW);
\
A10.SetDefaultColor(Color.GREEN);A11.SetDefaultColor(Color.GREEN);A12.SetDefaultColor(Color.GREEN);
A13.SetDefaultColor(Color.CYAN);A14.SetDefaultColor(Color.CYAN);A15.SetDefaultColor(Color.CYAN);
A16.SetDefaultColor(Color.PLUM);A17.SetDefaultColor(Color.PLUM);A18.SetDefaultColor(Color.PLUM);
A19.SetDefaultColor(Color.Violet);A20.SetDefaultColor(Color.Violet);A21.SetDefaultColor(Color.Violet);
A22.SetDefaultColor(Color.MAGENTA);A23.SetDefaultColor(Color.MAGENTA);A24.SetDefaultColor(Color.MAGENTA);
A25.SetDefaultColor(Color.PINK);A26.SetDefaultColor(Color.PINK);A27.SetDefaultColor(Color.PINK);
C-IMPLIED VOLATILITY LABEL AND PLOT
#hint: Implied Volatility label and plot

def Imp_Vol = imp_volatility(period = aggregationPeriod.DAY);
def impv = CompoundValue(1, if IsNaN(Imp_Vol) then impv[1] else Imp_Vol, Imp_Vol );
def value = impv;

#AddLabel(yes, "Implied Volatility = " + AsPercent(value));
plot x = value ;
C-INSIDE-BAR CODING
Comment: An inside bar is a frequent item of interest. Code related to such a bar is below:
#####Current bar is an inside Bar: Green if true #######
plot Data = if high <= high [1] and low >= low[1] then 1 else 0;
AssignBackgroundColor( if Data > 0 then Color.GREEN  else Color.BLACK );
Data.assignValueColor(color.BLACK);
###Prior Bar was an inside bar and current bar's high broke above prior bar high:Green if true ###
plot Data = if (high[1] <= high [2] and low[1] >= low[2]) and (high > high[1]) then 1 else 0;
AssignBackgroundColor( if Data > 0 then Color.GREEN else Color.BLACK );
Data.assignValueColor(color.BLACK);####Prior Bar was an inside bar and current bar's low broke below prior bar's low:Red if true #####
plot Data = if (high[1] <= high [2] and low[1] >= low[2]) and (low < low[1]) then -1 else 0;
AssignBackgroundColor( if Data < 0 then Color.RED else Color.BLACK );
Data.assignValueColor(color.BLACK);###Prior Bar was an inside bar and current bar broke above or below: Green above/Red below ###
plot Data = if (high[1] <= high [2] and low[1] >= low[2]) and (high > high[1]) then 1 else if (high[1] <= high [2] and low[1] >= low[2]) and (low < low[1]) then -1 else 0;
AssignBackgroundColor( if Data > 0 then Color.GREEN else if Data < 0 then Color.RED else Color.BLACK );
Data.assignValueColor(color.BLACK);###Another way to do it ###
def InUp = (high[1] <= high [2] and low[1] >= low[2]) and (high > high[1]);
def InDn = (high[1] <= high [2] and low[1] >= low[2]) and (low < low[1]);
plot Data = if InUp then 1 else if InDn then -1 else 0;
data.assignValueColor(color.BLACK);
assignBackgroundColor(if InUp then color.UPTICK else if InDn then color.DOWNTICK else color.BLACK);#######bulld: here is another related one ... NR7 bar #######
def range = AbsValue(high - low);
def diff = (range < range[1] and range < range[2] and range < range[3] and range < range[4] and range < range[5] and range < range[6]);
plot disp = high + (1/5);
disp.setDefaultColor(Color.White);
disp.assignValueColor(if diff > 0 then Color.White else Color.BLACK);C-IDENTIFYING AGGREGATION IN A LABEL
#hint: Identifying aggregation in a label
input Show_ChartPeriod = yes;
def AggPeriod = getAggregationPeriod();
AddLabel(Show_ChartPeriod,
if AggPeriod == AggregationPeriod.DAY
  then "DAY"
  else if AggPeriod == AggregationPeriod.WEEK
  then "WEEK"
  else if AggPeriod == AggregationPeriod.MONTH
  then "MONTH"
  else if Aggperiod < AggregationPeriod.DAY
  then "<D"
  else ">M",
Color.RED );
C-FIRST AND LAST BAR FOR PLACING A BUBBLE
#hint:Selects the first and last bar for placing a bubble

declare upper;
Input Offset = -10;
def LastBar = !IsNaN(open) and IsNaN(open [-1] ) ;
Def BubbleLocation = LastBar[Offset];
def barNum = barNumber();
def FirstBar = if barNum == 1 then 1 else 0;

AddLabel( yes, "Total bars = " + barNum, ), Color.pink );
addchartbubble(BubbleLocation , close, "Last Bar", color.white);
addchartbubble(FirstBar, close, "FirstBar", color.white);
Comment: HideBubble() Makes the last value bubble of a plot invisible. This is the bubble in e right margin and not on the chart itself.
C-DEFINE PREVIOUS DAY’S CLOSE
#Hint:Define Previous day's close

declare upper;
input price    = FundamentalType.Close;
def barNum     = if IsNaN( close ) then Double.NaN else barNumber();
def prevBarNum = HighestAll( barNum ) - 1;
def prevPrice  = if barNum == prevBarNum then fundamental( price ) else Double.NaN;
plot PreviousPriceLine = HighestAll( prevPrice );
PreviousPriceLine.SetDefaultColor( CreateColor( 102, 102, 102 );
C-CLOUDS WITHOUT A PLOT
#hint:Creating a cloud without a plot

input CloudThicknessPercentage = 100;#Hint  CloudThicknessPercentage:Percent of the cloud ickness to be plotted
def CloudThickness = ((close[1] - close) / 100) * CloudThicknessPercentage;
def highh = close + CloudThickness;
def highl = close - CloudThickness;
AddCloud(highh, highl, Color.RED, Color.GREEN);
C-COUNTS OF CONSECUTIVE RISES OR DROPS OF THE CLOSE
Comment: This is an excellent example of a simple recursive that counts
#hint:Plots of counts of consecutive rises or drops of the close.

def count_CloseDrops =
if Close < close[1] then count_CloseDrops[1] +1 else 0;
plot close_going_down = count_CloseDrops ;
close_going_down.SetPaintingStrategy(PaintingStrategy.line);
close_going_down.SetLineWeight(1);
close_going_down.SetDefaultColor(Color.red);
AddLabel(yes,  "Count of consecutive drops of the CLOSE = " +  Close_going_down ,color.red);

#######=== on the up side ###############
def count_CloseUps =
if Close > close[1] then count_CloseUps[1] +1 else 0;
plot close_going_up = count_CloseUps ;
close_going_up.SetPaintingStrategy(PaintingStrategy.line);
close_going_up.SetLineWeight(1);
close_going_up.SetDefaultColor(Color.green);
AddLabel(yes,  "Count of consecutive rises of the CLOSE = " +  Close_going_up ,color.green);

########=== Reference lines ############
Plot line2 = 2;
line2.SetDefaultColor(Color.light_gray);
Plot line4 = 4;
line4.SetDefaultColor(Color.gray);
Plot line6 = 6;
line6.SetDefaultColor(Color.light_gray);
Plot line8 = 8;
line8.SetDefaultColor(Color.gray);
Plot line10 = 10;
line10.SetDefaultColor(Color.light_gray);
Plot line12 = 12;
line12.SetDefaultColor(Color.gray);
C-DEFINE BAR AT A TIME AND DATE
#Define Bar at a time and date
plot Data1 = volume;
declare hide_on_daily;
def barnumber = BarNumber();
input time = 1100;
Input TodayDate = 20130104;
def GetYMD = GetYYYYMMDD() == TodayDate;
def timeTest = SecondsFromTime(time) == 0;
def BarID = CompoundValue(1, if timeTest && GetYMD then barnumber else Double.nan, barnumber());
#def BarIDNo = if(!isnan(BarID), Double.nan,barID);
AddLabel(yes, "BarNumber at arrow = " + BarID, color.white);#?????why this doesn't show BarID
Plot Data2 = BarID;#The barnumber value
Data2.setPaintingStrategy(PaintingStrategy.VALUES_below); # Arrow_Down, Arrow_Points,
Data2.SetDefaultColor(Color.Green); # for data plot
Data2.SetLineWeight(5);
Plot Data3 = BarID;#An arrow at the selected barnumber
Data3.setPaintingStrategy(PaintingStrategy.Arrow_down); # Arrow_Down, Arrow_Points,
Data3.SetDefaultColor(Color.Green); # for data plot
Data3.SetLineWeight(5);
AddChartBubble( timeTest && GetYMD, Volume , BarID + " is the base \nbar for comparison", lor.white, no);#Bubble
at the selected barnumber stating the barnumber
C-PRE/POST-MARKET SCAN & CHART
by Mobius©
input Begin  = 0930;
input End    = 1600;
def IsClosed = if SecondsFromTime(End) == 0 and
SecondsTillTime(End) == 0
then close
else IsClosed [1];#If market IsClosed then IsClosed's value = close
def data = if IsClosed > 0 then IsClosed else Double.NaN;
plot cond = close(priceType = "Mark") * 1.01 > IsClosed ;#Must use Mark in Pre/PostMarket
#Above uses 1.01 to scan for close > 1%. Change for your % desired.

################
Mobius©: this is the corresponding chart study
input Begin  = 0930;
input End    = 1600;

def Islosed = if SecondsFromTime(End) == 0 and
SecondsTillTime(End) == 0
then close
else IsClosed[1];#If market IsClosed then IsClosed's value = close
plot data = if IsClosed > 0 then IsClosed else Double.NaN;#Data is the fixed line to add or subtract the percentage from for the crossing condition

data.SetPaintingStrategy(PaintingStrategy.Dashes);
# In the plot below change 1.01 (1%)  to your desired %
plot cond = if close(priceType = "Mark") crosses above Data * 1.01 then low else Double.NaN; #Must use Mark in pre/postmarket

cond.SetPaintingStrategy(PaintingStrategy.Arrow_Up);
Comment1: Pre-market scan and chart may be had by changing 'End' to 'Begin' in the above code
Comment2: To display pre and post- market chart displays, click the wrench to open 'Chart Settings' and then go to 'equities' and check 'Show Extended Session'
-
C-ORDER BASED ON VALUE DIFFERENCE OF THREE AVERAGES
#hint:Order based on value difference of three averages
input averageType1 = {default Simple, Exponential, Weighted, Wilders, Hull};
input averageType2 = {default Simple, Exponential, Weighted, Wilders, Hull};
input averageType3 = {default Simple, Exponential, Weighted, Wilders, Hull};
input length1 = 10;
input length2 = 46;
input length3 = 230;
input val_diff = .05;

def price = close;

plot MovAvg1 = MovingAverage(averageType1,price, length1);
plot MovAvg2 = MovingAverage(averageType2,price, length1);
plot MovAvg3 = MovingAverage(averageType3,price, length1);
plot condition = absValue(MovAvg1 - MovAvg2) <= val_diff AND absValue(MovAvg1 - MovAvg3) <= l_diff AND absValue(MovAvg2 - MovAvg3) <= val_diff;

condition.setPaintingStrategy(paintingStrategy.BOOLEAN_ARROW_UP);

addOrder(OrderType.BUY_AUTO, condition);
addOrder(type = OrderType.SELL_TO_CLOSE,!condition);
C-DEFINES AGGREGATION IN A LABEL
#hint:Defines the aggregation in a label
def AggPeriod = getAggregationPeriod();
AddLabel(yes,concat("Aggregation Period =  ",
if AggPeriod == AggregationPeriod.min
then "1 MIN"
else if AggPeriod == AggregationPeriod.Two_Min
then "2 MINS"
else if AggPeriod == AggregationPeriod.Three_min
then "3 MINS"
else if AggPeriod == AggregationPeriod.Four_Min
then "4 MINS"
else if AggPeriod == AggregationPeriod.Five_min
then "5 MINS"
else if AggPeriod == AggregationPeriod.ten_min
then "10 MINS"
else if AggPeriod == AggregationPeriod.fifteen_min
then "15 MINS"
else if AggPeriod == AggregationPeriod.Twenty_min
then "20 MINS"
else if AggPeriod == AggregationPeriod.Thirty_min
then "30 MINS"
else if AggPeriod == AggregationPeriod.hour
then "1 HOUR"
else if AggPeriod == AggregationPeriod.TWO_Hours
then "2 HOURS"
else if AggPeriod == AggregationPeriod.Four_hours
then "4 HOURS"
else if AggPeriod == AggregationPeriod.DAY
then "DAY"
else if AggPeriod == AggregationPeriod.two_DAYs
then "2 DAYS"
else if AggPeriod == AggregationPeriod.three_DAYs
then "3 DAYS"
else if AggPeriod == AggregationPeriod.four_DAYs
then "4 DAYS"
else if AggPeriod == AggregationPeriod.week
then "WEEK"
else if AggPeriod == AggregationPeriod.MONTH
then "MONTH"
else "Use time charts only"),
Color.cyan);
AddLabel(yes,"Not for TICK or RANGE bar usage",color.red);
C-FIRST AND LAST BAR BUBBLES
declare upper;
Input Offset = -10;
def LastBar = !IsNaN(open) and IsNaN(open [-1] ) ;
Def BubbleLocation = LastBar[Offset];
def barNum = barNumber();
def FirstBar = if barNum == 1 then 1 else 0;
AddLabel( yes, "Total bars = " + barNum, ), Color.pink );
addchartbubble(BubbleLocation , close, "Last Bar", color.white);
addchartbubble(FirstBar, close, "FirstBar", color.white);
Comment HideBubble() Makes the last value bubble of a plot invisible. This is the bubble in the right margin and not onthe chart itself.
C- WEIGHTED MOVING AVERAGE AND FOLD USAGE
#Weighted Moving Average by Mobius
input price = close;
input length = 21;
plot WMA = (fold n = 0 to length
with s
do s + getValue(price, n, length - 1)
+ (fold i = 0 to length
with t
do t + getValue((1/price[1]), i, length - 1)))
/ length;
Comment: A good example of a nested fold. Note that the variable designations (n, s, i and t) cannot be duplicated in the folds.
#
C-COUNTER FOR NUMBER OF UP BARS
#hint:<b> Counts the number of bars where close  > open. </b>\n Yes/No options to show a summary label, count numbers and bar numbers.

input ShowBarNumb = No;#hint ShowBarNumb: Yes show the bar numbers below the low.
input ShowCountNos = yes;#hint ShowCountNos:Yes show the count of when close > open. It shows above the high.
input ShowLabel = yes;#hint ShowLabel:yes shows a summary label of the percent of bars that are up.

Def counter_AnyDay = CompoundValue (1,if close > open then counter_AnyDay[1] + 1 else counter_AnyDay[1],1);

plot count = if close > open  &&  ShowCountNos  then counter_AnyDay else double.nan;
Count.SetPaintingStrategy(PaintingStrategy.VALUES_ABOVE);

###below 2 lines convert to a line plot ###
#Count.SetPaintingStrategy(PaintingStrategy.line);
#Count.SetStyle(Curve.firm);

def BarNum = Barnumber();

plot Bar_Nos = if ShowBarNumb then BarNum else Double.NaN;
Bar_Nos.SetPaintingStrategy(PaintingStrategy.VALUES_BELOW);

Addlabel(ShowLabel, counter_AnyDay + " bars (" + (AsPercent(round(counter_AnyDay / barnumber(),2))) + ") out of a total of " + Barnumber() + " bars have close > open",color.cyan);
Comment: This counter can be easily converted to counting whatever you want. For example, if you want to count the number of days that have risen 1%, you would substitute the term 'close > open' with '(close/close[1] > 1.01) '. Naturally the aggregation is set to what you want to count like days, hours, 15 min bars, etc. The below code illustrates how this existing code can be taken and easily modified into another study. Compare the two.
C-COUNT OF CLOSE RISEN BY AN INPUTTED PERCENT
#hint:<b> Counts the number of bars where close has risen an inputted percent. </b>\n Yes/No options for label, count numbers and bar numbers.

input ShowBarNumb = No;#hint ShowBarNumb: Yes show the bar numbers below the low.
input ShowCountNos = yes;#hint ShowCountNos:Yes show the count of occurences. It shows above the high.
input ShowLabel = yes;#hint ShowLabel:Yes shows a summary label of the percent of bars that are up by the inputted percentage.

input PctUp = 0.5; #hint PctUp:<b>Show the percent rise desired</b>\nA stock infrequently rises more than  2% in a day.

def PctFactor = 1 + (PctUp /100);

Def counter_AnyDay =if close !=first(close) && (close/close[1] > PctFactor) then counter_AnyDay[1] + 1 else counter_AnyDay[1];

#Def counter_AnyDay = CompoundValue (1,if (close/close[1] > PctFactor) then counter_AnyDay[1] + 1 else counter_AnyDay[1],1);

plot count = if (close/close[1] > PctFactor)  &&  ShowCountNos  then counter_AnyDay else double.nan;

Count.SetPaintingStrategy(PaintingStrategy.VALUES_ABOVE);

###below 2 lines convert to a line plot  in lieu of showing values ###
#Count.SetPaintingStrategy(PaintingStrategy.line);
#Count.SetStyle(Curve.firm);

def BarNum = Barnumber();
plot Bar_Nos = if ShowBarNumb then BarNum else Double.NaN;
Bar_Nos.SetPaintingStrategy(PaintingStrategy.VALUES_BELOW);

Addlabel(ShowLabel, counter_AnyDay + " bars (" + (AsPercent(round(counter_AnyDay / barnumber(),2))) + ") out of a total of " + Barnumber() + " bars have (close/close[1] > " + PctUp +  "%",color.cyan);
addlabel(ShowLabel,"PctUp = " +  PctUp + "%", color.pink);
Comment: The label is complex and a good example of the use of '+' in lieu of the concat function.
C- PLOTS THE HIGH, LOW AND CLOSE OF ? DAYS AGO
#hint:<b>Plots the high, low and close of inputted days ago</b>\n The plots persist across the entire chart.\n Bubbles identify the plots.\nWorks for all aggregations thru 'Day'.

declare upper;
input LastBubble = No;#hint LastBubble: No omits the last bubble. May affect reading of data.
Input DaysAgo = 1;#hint DaysAgo: Excludes today
def  AdjDaysAgo = DaysAgo + 1;#Adjusted to match  a true LastDate which includes today

def day = GetDay();
def lastDay = GetLastDay();
def year = GetYear();
def lastYear = GetLastYear();
def yyyymmdd = GetYYYYMMDD();
def lastDate = HighestAll( if day == lastDay and year == lastYear then yyyymmdd else Double.NaN );
def currentDate = if yyyymmdd < lastDate then yyyymmdd else lastDate;
def previousDay = if CountTradingDays( currentDate, lastDate ) == AdjDaysAgo then yes else no;

plot PreviousHigh = HighestAll( if previousDay then high( period = "DAY" )
else Double.NaN );
plot PreviousLow = HighestAll( if previousDay then low( period = "DAY" )
else Double.NaN );
Plot PreviousClose = HighestAll( if previousDay then close( period = "DAY" ) else double.NaN);

#================ Look & Feel ==============
PreviousHigh.SetDefaultColor( Color.green );
PreviousHigh.SetLineWeight( 2 );
PreviousHigh.HideBubble();
PreviousLow.SetDefaultColor( Color.red);
PreviousLow.SetLineWeight( 2 );
PreviousLow.HideBubble();
PreviousClose.SetDefaultColor( Color.Yellow );
PreviousClose.SetLineWeight( 2 );
PreviousClose.HideBubble();

#=========== ID Bubbles ===================
Def barnum = barnumber();
def FirstBar = if barNum == 1 then 1 else 0;
addchartbubble(FirstBar, PreviousHigh, ("High of " + DaysAgo + " day(s) ago"), color.white);
addchartbubble(FirstBar, PreviousLow, ("Low of " + DaysAgo + " day(s) ago"), color.white);
addchartbubble(FirstBar, PreviousClose, ("Close of " + DaysAgo + " day(s) ago"), color.white);

#========= Last ID bubbles ==========
Input Offset = -10;
def LastBar = !IsNaN(open) and IsNaN(open [-1] ) ;
Def BubbleLocation = LastBar[Offset];
addchartbubble(BubbleLocation  && LastBubble, PreviousHigh, ("High of " + DaysAgo + " day(s) ago"), color.white);
addchartbubble(BubbleLocation  && LastBubble,PreviousLow, ("Low of " + DaysAgo + " day(s) ago"), color.white);
addchartbubble(BubbleLocation  && LastBubble, PreviousClose, ("Close of " + DaysAgo + " day(s) ago"), color.white);

Comment: The presence of 'HighestAll' in the plot statements causes to plots to persist across the entire chart. Otherwise, the plot will be for the single day defined.
C-DATE AND TIME USAGE EXAMPLES
Introduction and overview
The date and time functions take a lot of time to learn and much usage to feel comfortable with them. Hence, this section will be as thorough as possible with many examples to illustrate their usage. Additional examples will be added as they may surface online and in the chatroom.
-
GetDay,GetWeek,GetMonthandGetYearall relate to the CURRENT BAR and return values that relate to the ENTIRE YEAR: i.e. 1 to 366, 1 to 53, 1 to 12, and the year respectively. -
GetLastDay,GetLastWeek,GetLastMonthandGetLastYearall relate to the LAST BAR and return values that relate to the ENTIRE YEAR: i.e. 1 to 366, 1 to 53, 1 to 12, and the year respectively. -
GetYYYYMMDD()is the most frequently used. Returns the date of the current bar in the YYYYMMDD format. This date corresponds to the day whose trading session contains the current bar. Note that on intraday charts, this date and the actual date might not be the same for Forex and Futures symbols. -
GetDayofWeek,GetDayofMonth,RegularTradingEndandRegularTradingStartall utilize a yyyyMmDd input parameter format:The same output format asGetYYYYMMDD(). -
The 'fromDate', 'toDate’and 'tillDate' used in
CountTradingDays,DaysFromDateandDaysTillDateare all in the YYYYMMDD format.
In summary, all date/time functions beginning with 'Get……..', except for GetDayOfWeek and GetDayOfMonth, have no parameters. All date/time functions having parameters, except for SecondsFromTime and SecondsTillTime, use a parameter format of YYYYMMDD. SecondsFromTime and SecondsTillTime use a HHMM format.
REMEMBER THAT DATE/TIME FUNCTIONS RELATE TO A BAR ON A CHART. NO BAR THEN THE DATE/TIME RETURNED VALUES ARE NOT RELIABLE.
Define previous day
def previousDay = if CountTradingDays(CurrentDate, LastDate ) == 2 then yes else no;
Comment 1: The '==2' may be changed to represent any previous days-ago
Comment 2: CountTradingDays includes the CurrentDate and the LastDate in the count
Between two input dates
#hint: Between the two input dates
#hint startDateYyyyMmDd: Select starting date of line.
#hint endDateYyyyMmDd: Select ending date of line.

input startDateYyyyMmDd = 20100720;
input endDateYyyyMmDd = 20100916;
def start = if getYyyyMmDd()==startDateYyyyMmDd then 1 else 0;
def end = if getYyyyMmDd()==endDateYyyyMmDd then 1 else 0;
Usage: The above two line are conditions that you use to restrict your data
Example:
plot trendLine = if start then startPrice else if end then endPrice else double.nan;
Return 'the day-of-the-week' of the first bar of the chart
Def DayOfWeek = GetDayOfWeek(First(yyyymmdd)); #Mon =1, Tues =2, Wed = 3, Thurs = 4, Fri = 5, Sat = 6, Sun = 7
Define a time range (beginning and end)
Comment 1: 'SecondsFromTime' and 'Seconds TillTime' work smoothly during market hours but beware after-hours. A time is always associated with a bar. If there is no bar, TOS will have a problem
Comment 2: Thinly trader stocks may not have a bar at the time defined. Beware for the same reason as above.
Example 1:
========  SecondsFromTime ========

#Hint: his defines a time range during which the close will be plotted.
input OpenTime = 1130;
input DurationHours = 5;
def durationSec = DurationHours * 60 * 60;
def secondsPassed = SecondsFromTime(OpenTime);
plot Price = if secondsPassed >= 0 and secondsPassed <= durationSec then close else  double.NaN;
Comment 3: "if secondsPassed >= 0 and secondsPassed ⇐ durationSec then….." may be applied to any activity you want to do.
Example 2:
========  SecondsFromTime & SecondsTillTime ========
# Defines the hours from last bar till end-of-day (midnight) on an intra-day chart
input time = 0001;# Is midnight which is the start of counting seconds in the functions below.
def TimeFrom = SecondsFromTime(time);# Returns the seconds from 'time'. If not an intra-day chart, returns 0.

def TimeLeft = SecondsTillTime(time);# Returns the seconds till input 'time'. If not an intra-day chart, returns 0.

AddLabel(1, "Time from last bar till end-of-day (midnight) = " +(Round( (24 + (TimeLeft / 3600)),1)) + " Hours",color.white);
GetYYYYMMDD() & its formatting
Returns the date of the current bar. If there is no bar on a chart, like in pre and after-market hours or weekends and holidays, then results, including label values, from the date/time functions are not reliable.
A typical GetYYYYMMDD() result date is 20,131,107. This result doesn’t look like a date especially with the commas but it is.
When GetYYYYMMDD() is compared to an inputted date the commas are omitted in the input date. An example is input endDate = 20100101;
Functions that use GetYYYYMMDD() as a parameter are:
-
GetDayOfWeek(int yyyyMmDd);#Returns the day of week from 1 (Monday) to 7 (Sunday). -
GetDayOfMonth(int yyyyMmDd);#Returns number of the day in the month. -
RegularTradingEnd(int yyyyMmDd);#Returns the end of the regular trading hours for the current symbol on the trading day specified in the YYYYMMDD. This value is the number of milliseconds since the epoch (January 1, 1970, 00:00:00 GMT). -
RegularTradingStart(int yyyyMmDd);Returns the start of the regular trading hours for the current symbol on the trading day specified in the YYYYDDMM format. This value is the number of milliseconds since the epoch (January 1, 1970, 00:00:00 GMT).
Usage example 1:
`def yyyymmdd = GetYYYYMMDD(); `#Returns the date of the chart’s current bar. During trading hours this is also today’s date. If run on a weekend, this is not today’s date since there is no current bar for today.
Assuming that 20,131,107 was returned it can be formatted into a normal view as follows:
AddLabel(yes,"Converted getYyyyMmDd() = " + getMonth() + "/" + getDayOfMonth(getYyyyMmDd()) + "/" + AsPrice(getYear()) ,color.pink);
This label produces
Usage example 2:
def yyyymmdd = GetYYYYMMDD();# The date of the chart's current(last) bard

DaysFromDate(First(yyyymmdd));# This defines the number of days from the first bar of the chart to the last bar (current bar).

GetDayOfWeek(First(yyyymmdd));# Returns the day-of-week (mon to sun = 1 yo 7) of the charts first bar.
Usage example 3:
input anchor_date = 20111004;
def start = if getYyyyMmDd() == anchor_date then 1 else 0; # If at the anchor date, start is true.
def startprice = if start then close else startprice[1]; # Gets the close at the 'start' date
def gain = close - startprice; # defines the gain from the start price at the start date
DaysFromDate( ) & GetYYYYMMDD()
Returns the number of days from the specified date in YYYYMMDD format.
Usage example 1:
input anchor_date = 20111004;
def num_days = DaysFromDate(anchor_date);
def gain = close - close[num_days];
Usage example 2:
#hint Plots the close for 50 days from the 'BeginDate'
input BeginDate = 20090101;
plot Price = if DaysFromDate(BeginDate) >= 0 and DaysFromDate(BeginDate) <= 50 then close else double.NaN;
Usage example 3:
#Hint: In the script below, "count" counts calendar days, while "count2" counts trading days, between the startDate and today.
declare lower;
input startDate = 20130201;
plot count  = if startDate <= GetYYYYMMDD() then DaysFromDate( startDate ) else Double.NaN;
plot count2 = if startDate <= GetYYYYMMDD() then CountTradingDays( startDate, if( GetYYYYMMDD() < startDate,
  startDate, GetYYYYMMDD() ) ) else Double.NaN;
Usage example 4:
#Stock scan for all stocks down 25% (from example) from the Highest over the last ?? months
#Enter numMonths and PctDown

input numMonths = 6;   #Months to be scanned
input daysInMonth = 21;   # average std.
input price = close;
input PctDown = 25;  #percent below highestHigh

Def TotalDays = numMonths * daysInMonth;

Def PriceTrue = if close <=  ((1 - PctDown/100) * Highest(Price,TotalDays)) then 1 else 0;
Plot AllTrue  = if PriceTrue then 1 else 0;
Alternate
#Def TimeTrue  = if 0 < daysFromDate(20120101) and daysFromDate(20120101) < 160 then 1 else 0;
#Plot AllTrue  = if PriceTrue and TimeTrue then 1 else 0;
SecondsFromTime() & SecondsTillTime() & others
Returns the number of seconds from/till the specified time (24-hour clock notation) in the EST timezone. For intra-day only.
Usage example 1:
Scan for PreMarket that shows stocks > 1% from Bid above Close last nite? After-hours must be activated in settings.
input Begin  = 0930;
input End    = 1600;

def IsClosed = if SecondsFromTime(End) == 0 and
  SecondsTillTime(End) == 0
  then close
  else IsClosed [1];
def data = if IsClosed > 0 then IsClosed else Double.NaN;

plot cond = close(priceType = "Mark") * 1.01 > IsClosed ;#Must use Mark in Pre/PostMarket
Usage example 2:
#hint: Used in opening range studies to define that market is open.
input OpenTime          = 0930;
input CloseTime         = 1600;
def secondsFromOpen     = SecondsFromTime( OpenTime );
def secondsTillClose    = SecondsTillTime( CloseTime );
def marketOpen          = secondsFromOpen >= 0 and secondsTillClose >= 0;
Usage example 3:
#Defines properties for showing vertical lines
input ShowLines = Yes;
input ShowTodayOnly = Yes;

def day = getDay();
def last = getLastDay();
def Today = if(day==last,1,0);
def Show = if(ShowTodayOnly and Today, 1,if(!ShowTodayOnly,1,0));

input LowerMiddayBound = 1130;
input UpperMiddayBound = 1330;

def Lines = if((between(secondsFromTime(LowerMiddayBound), 1, 300)), 1,
if((between(secondsFromTime(UpperMiddayBound), 1, 300)), 1, 0));
AddVerticalLine(Show and ShowLines and Lines,"", Color.RED);
Usage example 4:
#hint: Used to define if OR (Opening Range) is active.

def ORBegin = 955;
def OREnd = 1005;
Def ORActive = if secondstilltime(OREnd) > 0 AND secondsfromtime(ORBegin) >= 0 then 1 else 0;
Usage example 5:
#hint: Used to define whether market is open

input marketOpenTime = 0930;
input marketCloseTime = 1615;

def closeByPeriod = close(period = "DAY")[-1];
def openbyperiod = open(period = "DAY")[-1];
def secondsFromOpen = secondsFromTime(marketOpenTime);
def secondsTillClose = secondsTillTime(marketCloseTime);
def marketOpen = if secondsFromOpen >= 0 and secondsTillClose > 0 then yes else no;
def newDay = if !IsNaN(closeByPeriod) then 0 else 1;
Usage example 6:
#hint:Add Vertical Line

def NineThirty = secondsFromTime(930) > 0;
def TwelveOclock = secondsFromTime(1200) > 0;
def MarketOpen = NineThirty > 0 && NineThirty [1] <= 0;
def LunchTime = TwelveOclock > 0 && TwelveOclock[1] <= 0;
AddVerticalLine(MarketOpen or LunchTime,if MarketOpen then "TIME TO TRADE!" else "LUNCH TIME",if MarketOpen then color.GREEN else color.BLUE);
Usage example 7:
#Hint: Identifies a bar at a time and date
plot Data1 = volume;
declare hide_on_daily;
def barnumber = BarNumber();
input time = 1100;
Input TodayDate = 20130104;
def GetYMD = GetYYYYMMDD() == TodayDate;
def timeTest = SecondsFromTime(time) == 0;
def BarID = CompoundValue(1, if timeTest && GetYMD then barnumber else Double.nan, barnumber());
#def BarIDNo = if(!isnan(BarID), Double.nan,barID);
AddLabel(yes, "BarNumber at arrow = " + BarID, color.white);#?????why this doesn't show BarID
Plot Data2 = BarID;#The barnumber value
Data2.setPaintingStrategy(PaintingStrategy.VALUES_below); # Arrow_Down, Arrow_Points,
Data2.SetDefaultColor(Color.Green); # for data plot
Data2.SetLineWeight(5);
Plot Data3 = BarID;#An arrow at the selected barnumber
Data3.setPaintingStrategy(PaintingStrategy.Arrow_down); # Arrow_Down, Arrow_Points,
Data3.SetDefaultColor(Color.Green); # for data plot
Data3.SetLineWeight(5);
AddChartBubble( timeTest && GetYMD, Volume , BarID + " is the base \nbar for comparison", Color.white, no);#Bubble at the selected barnumber stating the barnumber

#AddLabel(yes, Concat("GetYYYYMMDD() = ", GetYYYYMMDD()));
CountTradingDays & YearStart
#Counts the number of trading days from first of the year to current day.
def YearStart = GetYear() * 10000 + 101;#This defines January 1 of the current year. Good to keep handy.

AddLabel(yes, CountTradingDays(yearstart, GetYYYYMMDD()) + " trading days since year start")
======= DaysTillDate & GetLastDay & GetYear & GetYYYYMMDD() ========
Usage example 1:
declare lower;
input DaysToInclude = 90;
def Last90Days = daysTillDate(getYyyyMmDd()[-DaysToInclude]) < 0;
plot Data = Last90Days;
Comment: Above plots a horizontal line at a value of 1 (true)for 90 days. The following code will plot the close for 90 days.
Plot data2 = If Last90Days then close else double.nan;
Usage example 2:
#Hint: Plots a horizontal line at yesterday's low across the entire chart.This works if you have at least two days data on the chart.

declare upper;
def lastDaysDate      = HighestAll( if getLastDay() == getDay() and getLastYear() == getYear() then getYyyyMmDd() else Double.NaN );

def lastDaysLow     = if daysTillDate( lastDaysDate ) == 1 then Low( period = "DAY" ) else Double.NaN;

plot yesterdaysClose = HighestAll( lastDaysLow );-
======= DaysFromDate & GetYyyyMmDd() & getDayOfWeek ========
Usage example 1:
#hint: Plots the close for bars in the 50 days interval starting from BeginDate

input BeginDate = 20130101;

plot Price = if DaysFromDate(BeginDate) >= 0 and DaysFromDate(BeginDate) <= 50 then close else double.NaN;
Usage example 2:
#hint: Displays the Point of Control plot for weekly TPO profiles.

def yyyymmdd = getYyyyMmDd();
def day_number = daysFromDate(first(yyyymmdd)) + getDayOfWeek(first(yyyymmdd));
def period = floor(day_number / 7);
def cond = 0 < period - period[1];

profile tpo = timeProfile("startNewProfile" = cond, "onExpansion" = no);
tpo.show();
plot b = tpo.getPointOfControl();
======= DaysFromDate & GetMonth & GetDayOfMonth & GetYyyyMmDd() ========
#hint:Draws a vertical line at 10 bars from the last bar

input x = 10;

DefineGlobalColor( "VertLine", Color.Yellow );
def highestBar = HighestAll( if IsNaN(close) then Double.NaN else barNumber() );
def referenceBar = highestBar - x;
addVerticalLine( barNumber() == referenceBar,
  getMonth() +  "/" +  getDayOfMonth(getYyyyMmDd()) +  "/" +  getYear(),
  globalColor( "VertLine" )) ;
======= GetMonth & GetDayOfMonth & GetYyyyMmDd() ========
#By Jesse on the Mr. Script show

#hint: <b>Plot a line with value of a specified date</b>\nPlots a horizontal line across the entire chart. The line value is the close of the specified date. \nA bubble identifies the line

declare hide_on_intraday;

input Date = 20130604;#hint Date: Set the date you want see.<b>\n(Enter in YYYYMMDD)</b>
input price = CLOSE;
input show_line = Yes;#hint show_line: Show a horizontal line at this price<b>(Default is Yes)</b>

def timeTest = getYyyyMmDd() == date;
def data = if timetest then price  else double.nan;

plot Line = if show_line then highestall(data) else double.nan;
line.assignValueColor((if price == close then color.cyan else if price == open then color.pink else if price == low then color.yellow else if price == high then color.green else color.red));

def monthday = if timetest then getdayOfMonth(date) else double.nan;

def month = if timetest then getmonth() else double.nan;
AddChartBubble(timetest, price, "Date: " + month + "/" + monthday +  (if price == close then "   Close: $" else if price == open then "   Open: $" else if price == low then "   Low: $" else if price == high then "  High: $" else "   Value:  " )+ price, (if price == close then color.cyan else if price == open then color.pink else if price == low then color.yellow else if price == high then color.green else color.red), yes);
Comment: The AddChartBubble has coding worth studying. Using the '+' formatting syntax is recommended and has replaced the original 'Concat' syntax used by the author.
C-SCALPER’S HELPER W/ SQUEEZE
-
=== START STUDY
=== Scalper's Helper w/ Squeeze,  by Linus, Version = 2013-11-12.2
#hint: The Count plot adds the sum of price momentum comparisons with a counter of concurrent bars with no signaled direction change.  The Sig plot is a signal line colored to show if in or out of the squeeze.  (Lighter color is out of squeeze, by default.) \n\n Possible uses: \n\n If current Count is greater than previous Count of a different direction, and if not in the squeeze, look for possible breakout/breakdown or extension. \n\n If current Count is below Sig and previous Count was way above Sig, look for possible price direction change. \n\n Notes: \n\n Direction changes occur when the PPS signal changes and all the filters for that direction are either off or valid.  The Count plot is colored to show the current direction. (Green for up and Red for down, by default.)

declare lower;
input paintBars = No;    # hint paintBars: Yes to color price bars.
input diFilter = Yes;    #hint  diFilter: No to turn off DI filter.
input avgFilter = Yes;   #hint avgFilter: No to turn off mov. avg. filter.
input prFilter = Yes;    #hint prFilter: No to turn off price filter.
input price = close;     #hint price:  price fundamental.
input prMom = 1;         #hint prMom: offset for price (mom)entum.
input diLength = 13;     #hint diLength: For DI+, DI- calc, and mom sum.
input signal = 13;       #hint signal: Horiz. position of the Sig line.

#############################################
# Keltner Channel and Bollinger Band Squeeze:
input avgType = AverageType.SIMPLE; # Mov. avg type.
input avgLength = 20;    # length for band and channel mov. avg.
input numDev = 2.0;      # number of std devs of band.
input factor = 1.5;      # factor for offsetting channel.
def MA = MovingAverage(avgType, price, avgLength);

#inSqueeze is true if the upper band is inside the upper channel:
def inSqueeze = (MA + numDev * stdev(price, avgLength)) < (MA + (factor * AvgTrueRange(high, close, low, avgLength)));

#
#############################################
def hiDiff = high - high[1];
def loDiff = low[1] - low;
def ATR = WildersAverage(TrueRange(high, close, low), diLength);
#diDif is ("DI+" - "DI-")
def diDif = (100 * WildersAverage(if hiDiff > loDiff and hiDiff > 0 then hiDiff else 0, diLength) / ATR) - (100 * WildersAverage(if loDiff > hiDiff and loDiff > 0 then loDiff else 0, diLength) / ATR);

def ppsDir = CompoundValue(1, if !IsNaN(PPS().BuySignal) then 1 else if !IsNaN(PPS().SellSignal) then -1 else ppsDir[1], 0);

def diUp = !diFilter or (diFilter and diDif > 0 and diDif > diDif[1]);
def diDn = !diFilter or (diFilter and diDif < 0 and diDif < diDif[1]);
def avgUp = !avgFilter or (avgFilter and price > MA);
def avgDn = !avgFilter or (avgFilter and price < MA);

#Price momentum sums:
def sumUp = if prFilter then Sum(price > price[prMom], diLength) else 0;
def sumDn = if prFilter then Sum(price < price[prMom], diLength) else 0;
# prLbl=Off: Hide price momentum label.
# prLbl=All: Show prMom, sumUp and sumDn values.
# prLbl=UD:  Show only sumUp and sumDn values.

input prLbl = {default Off, All, UD};

AddLabel(prLbl!=prLbl.Off, (if prLbl==prLbl.All then "prMom=" + prMom + " :: " else "") + "U=" + sumUp + " :: D=" + sumDn, if sumUp > sumDn then Color.GREEN else if sumUp < sumDn then Color.RED else Color.GRAY);

#dir is 1 if last PPS signal was up, and up filters are valid or turned off;  dir is -1 if last PPS signal was down, and down filters are valid or turned off.

def dir = CompoundValue(1, if ppsDir > 0 and avgUp and diUp then 1 else if ppsDir < 0 and avgDn and diDn then -1 else dir[1], 0);

#Count the number of times dir is in one direction.
def dirCnt = compoundValue(1, if dir crosses 0 then 1 else dirCnt[1] + 1, 0);

#If dir is up (> 0) then add to dirCnt the sum of price bars moving up, else add to dir the sum of price bars moving down.

plot Count = if !isNaN(close) then
if dir > 0 then dirCnt + sumUp else dirCnt + sumDn
else Double.NaN;

#Sig is colored differently when in or out of squeeze.
plot Sig = if !isNaN(close) then signal else Double.NaN;
Sig.SetPaintingStrategy(PaintingStrategy.POINTS);
Sig.AssignValueColor(if inSqueeze then Color.DARK_GRAY else Color.WHITE);
Sig.SetDefaultColor(Color.GRAY);
Count.SetPaintingStrategy(PaintingStrategy.LINE_VS_POINTS);
Count.AssignValueColor(if dir > 0 then if count > Sig then Color.GREEN else Color.DARK_GREEN else if count > Sig then Color.RED else Color.DARK_RED);

AssignPriceColor(if !paintBars then Color.CURRENT else if dir > 0 then if Count > Sig then Color.GREEN  else Color.DARK_GREEN else if dir < 0 then if Count > Sig then Color.RED else Color.DARK_RED else Color.GRAY);
C-COLOR A PORTION OF A CHART
#Colors a portion of a chart from top to bottom between the times entered
input start = 0930;  # time in ET
input end = 1200;
def toPaint = SecondsFromTime(start) >= 0 and SecondsTillTime(end) > 0;
def up = if toPaint then Double.POSITIVE_INFINITY else Double.NaN;
# Unfortunetly Double.NEGATIVE_INFINITY does not work in AddCluod()
def down = if toPaint then LowestAll(low) else Double.NaN;
AddCloud(up, down, Color.RED);
C- CLOUD USAGE VIA MOVING AVERAGES
Comment: Clouds create nice looking charts. This illustrates the use of clouds using a popular analysis technique of two moving averages crossing.
#created Richard Houser - tos_thinkscript@yahoogroups.com
#Labels added by SFL
#TOS Title = CloudBetweenMovingAverages
#hint:Cloud usage between two moving averages

declare upper;
input price = close;
input fastLength = 8;
input fastAvgType = AverageType.SIMPLE;
input slowLength = 20;
input slowAvgType = AverageType.SIMPLE;

plot FastMva = MovingAverage( fastAvgType, price, fastLength );
plot SlowMva = MovingAverage( slowAvgType, price, slowLength );

AddCloud( FastMva, SlowMva, Color.YELLOW, Color.RED );

addlabel(1,"Slow MA(" +  slowLength  + ") is " +  (If fastAvgType == AverageType.EXPONENTIAL then "Exponential average" else if  fastAvgType == AverageType.Hull then "Hull average" else if fastAvgType == AverageType.simple then "Simple average" else if fastAvgType == AverageType.wilders then "Wilders average" else if fastAvgType == AverageType.weighted then "Weighted average" else "")   ,color.cyan);

-addlabel(1,"Fast MA(" +  fastLength  + ") is " +  (If slowAvgType == AverageType.EXPONENTIAL then "Exponential average" else if  slowAvgType == AverageType.Hull then "Hull average" else if slowAvgType == AverageType.simple then "Simple average" else if slowAvgType == AverageType.wilders then "Wilders average" else if slowAvgType == AverageType.weighted then "Weighted average" else "")   ,color.pink);
C-PLOTS THE DAILY HIGH AND LOW
#hint:<b>Daily_Hi_Lo</b>\nWhite lines show the current day's H/L range. Cyan shows the previous day's. The red line shows the previous day's close

input showOnlyLastPeriod = no;#hint showOnlyLastPeriod: NO shows today's and previous day's H/L. YES shows only the previous day's H/L

def  aggregationPeriod = AggregationPeriod.DAY;
def  length = 1;
def  displace = 0;
plot DailyHigh;
plot DailyLow;

if showOnlyLastPeriod and !IsNaN(close(period = aggregationPeriod)[-1]) {
  DailyHigh = Double.NaN;
  DailyLow = Double.NaN;
} else {
  DailyHigh = Highest(high(period = aggregationPeriod)[-displace], length);
  DailyLow = Lowest(low(period = aggregationPeriod)[-displace], length);
}

DailyHigh.SetDefaultColor(GetColor(9));
DailyHigh.SetPaintingStrategy(PaintingStrategy.HORIZONTAL);
DailyLow.SetDefaultColor(GetColor(9));
DailyLow.SetPaintingStrategy(PaintingStrategy.HORIZONTAL);

#************************************************************
def  PreDailyHigh = Highest(high(period = aggregationPeriod)[1], length);
def PreDailyLow = Lowest(low(period = aggregationPeriod)[1], length);
plot YesterHi = PreDailyHigh;
plot YesterLo = PreDailyLow;
YesterHi.SetDefaultColor(color.cyan);
YesterHi.SetPaintingStrategy(PaintingStrategy.HORIZONTAL);
YesterLo.SetDefaultColor(color.cyan);
YesterLo.SetPaintingStrategy(PaintingStrategy.HORIZONTAL);
#input timeFrame = {default DAY, WEEK, MONTH};
def YstrdaysClose = close(period = aggregationPeriod)[1];
plot YesterClose = YstrdaysClose;
YesterClose.SetDefaultColor(GetColor(5));
YesterClose.SetPaintingStrategy(PaintingStrategy.HORIZONTAL);

###########=== of Day vert line ########################
input time = 0930;
def StartTime = SecondsFromTime(time) ==0;
plot x = if StartTime then close else double.nan;
AddVerticalLine(StartTime,"Opening @ 9:30",Color.pink,Curve.SHORT_DASH);
X.Hide();
addLabel(yes,"Current Day's Hi/Lo",color.white);
addLabel(yes,"Previous day's Hi/Lo",color.cyan);
addLabel(yes,"Yesterday's Close",color.red);
C -SELF-ADJUSTING RSI BANDS
#Adapted by R. Houser from The Self-Adjusting RSI script at http://www.metastock.com/Customer/Resources/TASC/Article.aspx?Id=72

#hint:<b>Self-Adjusting RSI bands</b>\nThe RSI herein is exactly the same as TOS builtin RSI. The conventional OB/OS levels are replaced by the upper and lower bands based on the std dev of the RSI itself. The RSI above the upper band is bullish and below the lower band is bearish. Within the the bands is a choppy area. The widening of the bands indicates increasing volatility similar to the Bollinger Bands. The upper band may be interpreted as an moving OB level and the lower band  a moving OS level.

declare lower;
input Length  = 14;
input StdDevConst      = 1.8;
input SMA_const        = 2.0;
input Method        = { default SD, SMA };
input price     = close;

def _rsi        = RSIWilder( Length, price = price ).RSI;
def _stdev      = StDev( _rsi, Length );
def top         = if Method == Method.SD
  then 50 + ( StdDevConst *_stdev )
  else 50 + ( SMA_const * Average( AbsValue(_rsi - Average( _rsi, Length ) ), Length ) );
def bottom      = if Method == Method.SD
  then 50 - ( StdDevConst * _stdev )
  else 50 - ( SMA_const * Average( AbsValue( _rsi - Average( _rsi, Length ) ), Length ) );

plot RSI  = _rsi;
plot TopBand    = top;
plot LowerBand  = bottom;
Plot MidLine = 50;

MidLine.SetPaintingStrategy(PaintingStrategy.LINE);
MidLine.SetLineWeight(2);
MidLine.SetDefaultColor(Color.YELLOW);
MidLine.SetStyle(Curve.SHORT_DASH);
C-3 MOVING AVERAGES: CHANGING COLOR
#by R. Houser
#hint:<b>Three MVSs ascending/descending color change</b> \nWhen the MovingAverage is increasing in value it will change color, and when it is decreasing in value change color again. User is able to select color of MovingAverage line when it is increasing or decreasing

declare upper;
input fastLength    = 3;
input mediumLength  = 8;
input slowLength    = 21;
input price         = close;
input avgType       = AverageType.EXPONENTIAL;
plot fastMVA        = MovingAverage( avgType, price, fastLength );
plot mediumMVA      = MovingAverage( avgType, price, mediumLength );
plot slowMVA        = MovingAverage( avgType, price, slowLength );
fastMVA.DefineColor( "up",  GetColor( 0 ) );
fastMVA.DefineColor( "dn",  GetColor( 1 ) );
fastMVA.DefineColor( "def", GetColor( 2 ) );
fastMVA.AssignValueColor( if fastMVA > fastMVA[1] then fastMVA.Color( "up" ) else if fastMVA < fastMVA[1] then

fastMVA.Color( "dn" ) else fastMVA.Color( "def" ) );
mediumMva.DefineColor( "up",  GetColor( 3 ) );
mediumMva.DefineColor( "dn",  GetColor( 4 ) );
mediumMva.DefineColor( "def", GetColor( 5 ) );

mediumMva.AssignValueColor( if mediumMva > mediumMva[1] then mediumMva.Color( "up" ) else if
   mediumMva < mediumMva[1] then mediumMva.Color( "dn" ) else mediumMva.Color( "def" ) );

slowMVA.DefineColor( "up",  GetColor( 6 ) );
slowMVA.DefineColor( "dn",  GetColor( 7 ) );
slowMVA.DefineColor( "def", GetColor( 8 ) );
slowMVA.AssignValueColor( if slowMva > slowMva[1] then slowMva.Color( "up" ) else
  if slowMva < slowMva[1] then slowMva.Color( "dn" ) else slowMva.Color( "def" ) );

slowMVA.Hide();
C-T3, ADAPTIVE SMOOTHING INDICATOR
#Hint:<b>T3 - Adaptive Smoothing Indicator</b>
# by Richard Houser tos_thinkscript@yahoo.groups
# --------------------------------------------------------------------------------
#  The Formula . . .  . . .more on Formulas
# T3(n) = GD(GD(GD(n)))
# GD(n,v) = EMA(n)*(1+v) - EMA(EMA(n))*v
#     GD stands for Generalized DEMA (double-smoothed exponential MA)
# where
# n = Period
# v = Volume Factor
# http://www.linnsoft.com/tour/techind/t3.htm

declare upper;
script GD {
 input period        = 10;
 input volumeFactor  = 0.7;
 input price         = close;

 plot GD  = ExpAverage( price, period ) * ( 1 + volumeFactor ) - ( ExpAverage( ExpAverage( price,  period ), period ) * volumeFactor );
}

input period          = 10;
input volumeFactor    = 0.7;
input price           = close;
plot T3               = GD( period, volumeFactor, GD( period, volumeFactor, GD( period, volumeFactor, price ) ) );
C-RSI ZEROLINE OSCILLATOR
#hint: Plots the RSI oscillating about the ZeroLine in lieu of a OB/OS format
#TOS Title = RSI_Zero_Osc
#Comment: See the two methods of coloring a histogram in "#=== COLORING =" below.

declare lower;

input length = 14;
input price = close;

def NetChgAvg = WildersAverage(price - price[1], length);
def TotChgAvg = WildersAverage(AbsValue(price - price[1]), length);
def ChgRatio = if TotChgAvg != 0 then NetChgAvg / TotChgAvg else 0;

plot RSI = (50 * (ChgRatio + 1) - 50);
RSI.SetPaintingStrategy(PaintingStrategy.HISTOGRAM);
RSI.SetLineWeight(3);
RSI.HideTitle();
RSI.HideBubble();
#=== COLORING = If you want to omit the histogram bar coloring of light-to-dark, then un-comment the '====THE THREE===="  code lines below and comment-out the 5 lines shown below as '==== THE FIVE ====' below it.

#==== THE THREE ====
RSI.DefineColor("Positive", Color.UPTICK);
RSI.DefineColor("Negative", Color.DOWNTICK);
RSI.AssignValueColor(if RSI > 0 then RSI.Color("Positive") else RSI.Color("Negative"));
#==== THE FIVE ====
#RSI.DefineColor("Positive and Up", Color.GREEN);
#RSI.DefineColor("Positive and Down", Color.DARK_GREEN);
#RSI.DefineColor("Negative and Down", Color.RED);
#RSI.DefineColor("Negative and Up", Color.DARK_RED);
#RSI.AssignValueColor(if RSI >= 0 then if RSI > RSI[1] then RSI.Color("Positive and Up") else RSI.Color("Positive and Down") else if RSI < RSI[1] then RSI.Color("Negative and Down") else RSI.Color("Negative and Up"));

#################################
plot  ZeroLine = 0;
ZeroLine.SetDefaultColor(Color.YELLOW);
ZeroLine.SetLineWeight(1);
#The line below plots at the bar values and adds a lot of class to the looks of a histogram
plot RSI_Line = (50 * (ChgRatio + 1) - 50);
RSI_Line.SetDefaultColor(GetColor(1));
C-INSYNC INDEX
#Hint:<b>InSync Index</b>\nThis is index is formed from signals on a variety of different technical indicators, and used to determine extreme overbought/oversold values in the market.

#InSync Index
# Coded by Eric Rasmussen
#
# The InSync Index is used detect extreme levels.
# Values higher or equal to 50 are considered to be high extreme levels. (sell)
# Values lower or equal than -50 are considered to be low extreme levels. (buy)
declare lower;

#Data Smoothing Input
input smooth = 1;

#Study Definitions
def bbUpper  = BollingerBandsEMA().UpperBand;
def bbLower  = BollingerBandsEMA().LowerBand;
def bbCalc   = (close - bbLower)/(bbUpper - bbLower);
def macd1    = MACD(8, 17);
def macd2    = macd1 - (MACD(8, 10) - MACD(17, 20));
def rsi      = rsIWilder();
def change   = RateOfChange(10);
def dpo      = detrendedPriceOsc();
def eom      = easeOfMovement();
def mf       = moneyFlowIndex();
def stoch    = StochasticFull("k period" = 14);
def bomp     = balanceOfMarketPower();
def cc       = cci();

#Indicator Scoring
def bb       = if bbCalc > .95 then 5 else if bbCalc < .05 then -5 else 0;
def cci      = if cc > 100 then 5 else if cc < -100 then -5 else 0;
def macd     = if macd1 > 0 and macd2 > 0 then 5 else if macd1 < 0 and macd2 < 0 then -5 else 0;
def roc      = if change > 1 and change > expAverage(change, 10) then 5 else if change < 1 and change < expAverage(change, 10) then -5 else 0;

def sto      = if stoch > 80 then 10 else if stoch < 20 then -10 else 0;
def rsiW     = if rsi > 70 then 5 else if rsi < 30 then -5 else 0;
def bop      = if bomp > 0 and bomp > expAverage(bomp, 10) then 5 else if bomp < 0 and bomp < expAverage(bomp, 10) then -5 else 0;

def dp       = if dpo > 0 then 5 else if dpo < 0 then -5 else 0;
def emv      = if eom > 0 then 5 else if eom < 0 then -5 else 0;
def mfi      = if mf > 50 then 5 else if mf < 40 then -5 else 0;

#Point Sum
def sum      = bb + cci + macd + roc + sto + rsiW + bop + dp + emv + mfi;

#Plots
plot inSync  = expAverage(sum, smooth);
plot zero    = if isNaN(close) then double.NaN else 0;
plot pos55   = if isNaN(close) then double.NaN else 50;
plot neg55   = if isNaN(close) then double.NaN else -50;
inSync.assignValueColor(if sum > 0 then color.GREEN else color.RED);
inSync.setLineWeight(2);
zero.assignValueColor(color.LIGHT_GRAY);
pos55.assignValueColor(color.RED);
neg55.assignValueColor(color.GREEN);
zero.hideTitle();
pos55.hideTitle();
neg55.hideTitle();
#COMMENT: You can alter the criteria and/or the indicators to suit your trading style
C- CLOUD A TIME INTERVAL WITHOUT PLOTS
#hint:<b>Cloud a time interval without plots</b>

input start = 1000;  # hint start: Beginning time in 24-hour format ET
input end = 1300; #hint end:Ending time of the cloud

def toPaint = SecondsFromTime(start) >= 0 and SecondsTillTime(end) > 0;
def up = if toPaint then Double.POSITIVE_INFINITY else Double.NaN;

#Unfortunetly Double.NEGATIVE_INFINITY does not work in AddCluod()
def down = if toPaint then LowestAll(low) else Double.NaN;
AddCloud(up, down, Color.RED);
C- IMPROVED TIME SERIES FORECAST STUDY
#hint:<b>An improved TimeSeriesForecast study.</b> \nThe improvement is done here using a non-TOS correct regression slope calculation comparable with the RH's code on this topic. This is a substitute for the builtin 'TimeSeriesForecast'.

input price = close;
input avgType = AverageType.SIMPLE;
input avgLength = 1;#hint avgLength:Retain 1 used to get smoothPrice used herein
input regLength = 8;#hint regLength:The number of bars for which the statistical data is collected.
input barPlus = 3;#hint barplus:The number of bars for which the price is predicted. Specify positive number to obtain the forecast data, negative number to backtest indicator accuracy.
input numDevUp = 2.0;#hint numDevUp:Std Deviation for the upper band
input numDevDn = -2.0;#hint numDevDn:Std Deviation for the lower band

def smoothPrice = MovingAverage(avgType, price, avgLength);
def std = StDev(smoothPrice, regLength);

plot RegressionBand = reference TimeSeriesForecast(smoothPrice, regLength, barPlus);
plot UpperBand = RegressionBand + std * numDevUp;
plot LowerBand = RegressionBand + std * numDevDn;
#The buy/sell signals nelow are rudimentary and should not be used without other strong confirmatioms

plot Buy = if RegressionBand < RegressionBand[1]  && RegressionBand[-1] > RegressionBand &&  RegressionBand[-2] > (RegressionBand[-1] ) then RegressionBand Else double.nan;

Buy.SetPaintingStrategy(PaintingStrategy.ARROW_UP);
Buy.SetLineWeight(5);
Buy.SetDefaultColor(Color.GREEN);

plot Sell = if RegressionBand > RegressionBand[1]  && RegressionBand[-1] < (RegressionBand ) &&  RegressionBand[-2] <(RegressionBand[-1] ) then RegressionBand Else double.nan;
Sell.SetPaintingStrategy(PaintingStrategy.ARROW_DOWN);
Sell.SetLineWeight(5);
Sell.SetDefaultColor(Color.RED);
#Comment: Higher aggregations of 15 and 30-mins produce less whipsaw.
C-VOLATILITY LABEL
#hint:Places a volatility label on the upper panel
#begin
declare upper;
def IV = Round(ImpVolatility() * 100);
def HV = Round(HistoricalVolatility() * 100);
AddLabel(yes, "ImpVolatility = " + IV + " % and  HistoricalVolatility = " + HV + " %", color.green);
Comment:HV and IV do not plot on intraday. The default HV is annual and that is what will show in the label. On an intraday chart the IV will show N/A and the HV will be annual HV. to get the daily value of Implied Volatility:
def DaysIV = IV / Sqrt(252);
C-'BATTLE OF THE BANDS' RE IMPLIED VOLATILITY
#hint:Battle of the Bands Indicates the range of price using Implied Volatility, Bollinger Bands or Keltner Channel. No direction (up or down) is implied since price is assumed random by the calculations.  Mobius©: # Battle of the Bands

#Implied Volatility Bands
# ATR Bands
# Bollinger Bands
# Mobius
# Added ATR label. Added conditional color for labels. Altered bands on lower aggs. to 100% IV spread from mean. Altered coding structure to be more efficient.

#V02.10.17.2013

declare hide_on_daily;
input n = 21;
input IvDailyBands = no;
input IvHourBands = no;
input IV15minBands = yes;
input AtrBands = no;
input BollingerBands = yes;
input DisplayLabels = yes;

def o = open;
def h = high;
def l = low;
def c = close;
def period = AggregationPeriod.DAY;
def hd = high(period = period);
def ld = low(period = period);
def cd = close(period = period);
def DaysMean = hl2(period = period);
def HoursMean = hl2(period = AggregationPeriod.HOUR);
def IVd = imp_Volatility(period = period);
def IV = if isNaN(IVd) then IV[1] else IVd;
def hIV = Highest(IV, 252);
def lIV = Lowest(IV, 252);
def IVpercentile = (IV - lIV) / (hIV - lIV);
AddLabel(DisplayLabels, "IV " + AsPercent(IV) + "  IV Percentile: " + AsPercent(IVpercentile)
, if IsAscending(IV)
    then Color.GREEN
    else if IsDescending(IV)
    then Color.RED
    else Color.WHITE);

def ATR = Average(TrueRange(h, c, l), n);
def ATRd = Average(TrueRange(hd, cd, ld), n);
def SDatr = StDev(ATRd, 252);
def hATR = Highest(SDatr, 252);
def lATR = Lowest(SDatr, 252);
def ATRpercentile = (SDatr - lATR) / (hATR - lATR);
def DaysIV = IV / Sqrt(252);
def DaysIVSD = StDev(DaysIV, n);
def DaysIVValue = Round((DaysMean * DaysIV) / TickSize(), 0) * TickSize();
AddLabel(DisplayLabels, Concat("Days IV " + AsPercent(DaysIV), " Value $" + DaysIVValue),
if IsAscending(DaysIV)
  then Color.GREEN
  else if IsDescending(DaysIV)
  then Color.RED
  else Color.WHITE);

def HoursIV = IV / Sqrt(5796);
def HoursIVSD = StDev(HoursIV, n);
def HoursIVValue = Round((HoursMean * HoursIV) / TickSize(), 0) * TickSize();
AddLabel(DisplayLabels, Concat("Hours IV " + AsPercent(HoursIV), " Value $" + HoursIVValue),
if IsAscending(HoursIV)
then Color.GREEN
else if IsDescending(HoursIV)
then Color.RED
else Color.WHITE);
def IV15min = IV / Sqrt(23184);
def IV15minSD = StDev(IV15min, n);
def IV15mValue = Round((c * IV15min) / TickSize(), 0) * TickSize();

AddLabel(DisplayLabels, Concat("15min IV " + AsPercent(IV15min), " Value $" + IV15mValue),
if IsAscending(IV15min) then Color.GREEN
else if IsDescending(IV15min)
then Color.RED else Color.WHITE);

plot DaysIVhigh = DaysMean + ((DaysIVValue) / 2);
DaysIVhigh.SetDefaultColor(Color.WHITE);
DaysIVhigh.SetHiding(!IvDailyBands);
DaysIVhigh.SetPaintingStrategy(PaintingStrategy.DASHES);

plot DaysIVlow = DaysMean - ((DaysIVValue) / 2);
DaysIVlow.SetDefaultColor(Color.WHITE);
DaysIVlow.SetHiding(!IvDailyBands);
DaysIVlow.SetPaintingStrategy(PaintingStrategy.DASHES);

plot HoursIVhigh = Average(HoursMean + HoursIVValue, n);
HoursIVhigh.SetDefaultColor(Color.CYAN);
HoursIVhigh.SetHiding(!IvHourBands);

plot HoursIVlow = Average(HoursMean - HoursIVValue, n);
HoursIVlow.SetDefaultColor(Color.CYAN);
HoursIVlow.SetHiding(!IvHourBands);

plot IV15minhigh = Inertia(c + (c * IV15minSD), n);
IV15minhigh.SetDefaultColor(Color.YELLOW);
IV15minhigh.SetHiding(!IV15minBands);

plot IV15minlow = Inertia(c - (c * IV15minSD), n);
IV15minlow.SetDefaultColor(Color.YELLOW);
IV15minlow.SetHiding(!IV15minBands);

plot ATRup = Inertia(c + ATR, n);
ATRup.SetHiding(!AtrBands);

plot ATRdn = Inertia(c - ATR, n);
ATRdn.SetHiding(!AtrBands);

def SD = StDev(close, n);
def Avg = Average(close, n);

plot SDup = Avg + (2 * SD);
SDup.SetDefaultColor(Color.GREEN);
SDup.SetHiding(!BollingerBands);

plot SDdn = Avg + (-2 * SD);
SDdn.SetDefaultColor(Color.GREEN);
SDdn.SetHiding(!BollingerBands);

AssignPriceColor(if (SDup < IV15minhigh) or (SDdn > IV15minlow)
  then Color.PLUM
  else Color.CURRENT);

AddLabel(DisplayLabels, "ATR Chart Agg. = $" + (Round(ATR / TickSize(), 0) * TickSize()) +
"  ATR Daily $" + (Round(ATRd / TickSize(), 0) * TickSize()) +
"  ATR Percentile: " + AsPercent(ATRpercentile),
  if ATR > ATR[1]
  then Color.GREEN
  else if ATR < ATR[1]
  then Color.RED
  else Color.WHITE);
Code Battle of the Bands
C-THE BEAUTIFUL 'GAUSSIAN RAINBOW'
#hint:Possibly the most beautiful chart you will see in ThinkScript.
# Gaussian Rainbow
#    - Coded and Developed by Eric Rasmussen
#    - 11/24/2013

declare upper;

#Study Inputs
input gaussian       = { "ONE", "TWO", "THREE", default "FOUR" };
input data           = OHLC4;
input length         = 10;
input gaussianOrder  = 3;
input cloud          = yes;

#Definitions
def w; def beta; def alpha;
def rbi1; def rbi2; def rbi3; def rbi4;
def rbi5; def rbi6;def rbi7; def rbi8;

#Alpha Calculation
w                = ( 2 * double.Pi / length );
beta             = ( 1 - cos( w ) ) / ( power( 1.414, 2.0 / gaussianOrder ) - 1 );
alpha            = ( -beta + sqRt( beta * beta + 2 * beta) );

#Average Calculations
switch( gaussian ) {
  case "ONE":
    rbi1         =       alpha * data + ( 1 - alpha ) * rbi1[1];
    rbi2         =       alpha * rbi1 + ( 1 - alpha ) * rbi2[1];
    rbi3         =       alpha * rbi2 + ( 1 - alpha ) * rbi3[1];
    rbi4         =       alpha * rbi3 + ( 1 - alpha ) * rbi4[1];
    rbi5         =       alpha * rbi4 + ( 1 - alpha ) * rbi5[1];
    rbi6         =       alpha * rbi5 + ( 1 - alpha ) * rbi6[1];
    rbi7         =       alpha * rbi6 + ( 1 - alpha ) * rbi7[1];
    rbi8         =       alpha * rbi7 + ( 1 - alpha ) * rbi8[1];

  case "TWO":
    rbi1         =       power( alpha, 2 )     * data    +
    2 *      ( 1 - alpha )    * rbi1[1] -
    power( 1 - alpha, 2 ) * rbi1[2];
    rbi2         =       power( alpha, 2 )     * rbi1    +
    2 *      ( 1 - alpha )    * rbi2[1] -
    power( 1 - alpha, 2 ) * rbi2[2];
    rbi3         =       power( alpha, 2 )     * rbi2    +
    2 *      ( 1 - alpha )    * rbi3[1] -
    power( 1 - alpha, 2 ) * rbi3[2];
    rbi4         =       power( alpha, 2 )     * rbi3    +
    2 *      ( 1 - alpha )    * rbi4[1] -
    power( 1 - alpha, 2 ) * rbi4[2];
    rbi5         =       power( alpha, 2 )     * rbi4    +
    2 *      ( 1 - alpha )    * rbi5[1] -
    power( 1 - alpha, 2 ) * rbi5[2];
    rbi6         =       power( alpha, 2 )     * rbi5    +
    2 *      ( 1 - alpha )    * rbi6[1] -
    power( 1 - alpha, 2 ) * rbi6[2];
    rbi7         =       power( alpha, 2 )     * rbi6    +
    2 *      ( 1 - alpha )    * rbi7[1] -
    power( 1 - alpha, 2 ) * rbi7[2];
    rbi8         =       power( alpha, 2 )     * rbi7    +
    2 *      ( 1 - alpha )    * rbi8[1] -
    power( 1 - alpha, 2 ) * rbi8[2];
  case "THREE":
    rbi1        =       power( alpha, 3 )     * data    +
    3 *      ( 1 – alpha )    * rbi1[1] -
    3 * power( 1 - alpha, 2 ) * rbi1[2] +
    power( 1 - alpha, 3 ) * rbi1[3];
    rbi2        =       power( alpha, 3 )     * rbi1    +
    3 *      ( 1 – alpha )    * rbi2[1] -
    3 * power( 1 - alpha, 2 ) * rbi2[2] +
    power( 1 - alpha, 3 ) * rbi2[3];
    rbi3        =       power( alpha, 3 )     * rbi2    +
    3 *      ( 1 – alpha )    * rbi3[1] -
    3 * power( 1 - alpha, 2 ) * rbi3[2] +
    power( 1 - alpha, 3 ) * rbi3[3];
    rbi4        =       power( alpha, 3 )     * rbi3    +
    3 *      ( 1 – alpha )    * rbi4[1] -
    3 * power( 1 - alpha, 2 ) * rbi4[2] +
    power( 1 - alpha, 3 ) * rbi4[3];
    rbi5        =       power( alpha, 3 )     * rbi4    +
    3 *      ( 1 – alpha )    * rbi5[1] -
    3 * power( 1 - alpha, 2 ) * rbi5[2] +
    power( 1 - alpha, 3 ) * rbi5[3];
    rbi6        =       power( alpha, 3 )     * rbi5    +
    3 *      ( 1 – alpha )    * rbi6[1] -
    3 * power( 1 - alpha, 2 ) * rbi6[2] +
    power( 1 - alpha, 3 ) * rbi6[3];
    rbi7        =       power( alpha, 3 )     * rbi6    +
    3 *      ( 1 – alpha )    * rbi7[1] -
    3 * power( 1 - alpha, 2 ) * rbi7[2] +
    power( 1 - alpha, 3 ) * rbi7[3];
    rbi8        =       power( alpha, 3 )     * rbi7    +
    3 *      ( 1 – alpha )    * rbi8[1] -
    3 * power( 1 - alpha, 2 ) * rbi8[2] +
    power( 1 - alpha, 3 ) * rbi8[3];
  case "FOUR":
    rbi1        =       power( alpha, 4 )     * data    +
    4 *      ( 1 – alpha )    * rbi1[1] –
    6 * power( 1 - alpha, 2 ) * rbi1[2] +
    4 * power( 1 - alpha, 3 ) * rbi1[3] -
    power( 1 - alpha, 4 ) * rbi1[4];
    rbi2        =       power( alpha, 4 )     * rbi1    +
    4 *      ( 1 – alpha )    * rbi2[1] –
    6 * power( 1 - alpha, 2 ) * rbi2[2] +
    4 * power( 1 - alpha, 3 ) * rbi2[3] -
    power( 1 - alpha, 4 ) * rbi2[4];
    rbi3        =       power( alpha, 4 )     * rbi2    +
    4 *      ( 1 – alpha )    * rbi3[1] –
    6 * power( 1 - alpha, 2 ) * rbi3[2] +
    4 * power( 1 - alpha, 3 ) * rbi3[3] -
    power( 1 - alpha, 4 ) * rbi3[4];
    rbi4        =       power( alpha, 4 )     * rbi3    +
    4 *      ( 1 – alpha )    * rbi4[1] –
    6 * power( 1 - alpha, 2 ) * rbi4[2] +
    4 * power( 1 - alpha, 3 ) * rbi4[3] -
    power( 1 - alpha, 4 ) * rbi4[4];
    rbi5        =       power( alpha, 4 )     * rbi4    +
    4 *      ( 1 – alpha )    * rbi5[1] –
    6 * power( 1 - alpha, 2 ) * rbi5[2] +
    4 * power( 1 - alpha, 3 ) * rbi5[3] -
    power( 1 - alpha, 4 ) * rbi5[4];
    rbi6        =       power( alpha, 4 )     * rbi5    +
    4 *      ( 1 – alpha )    * rbi6[1] –
    6 * power( 1 - alpha, 2 ) * rbi6[2] +
    4 * power( 1 - alpha, 3 ) * rbi6[3] -
    power( 1 - alpha, 4 ) * rbi6[4];
    rbi7        =       power( alpha, 4 )     * rbi6    +
    4 *      ( 1 – alpha )    * rbi7[1] –
    6 * power( 1 - alpha, 2 ) * rbi7[2] +
    4 * power( 1 - alpha, 3 ) * rbi7[3] -
    power( 1 - alpha, 4 ) * rbi7[4];
    rbi8        =       power( alpha, 4 )     * rbi7    +
    4 *      ( 1 – alpha )    * rbi8[1] –
    6 * power( 1 - alpha, 2 ) * rbi8[2] +
    4 * power( 1 - alpha, 3 ) * rbi8[3] -
    power( 1 - alpha, 4 ) * rbi8[4];
}

#plots
plot ga1 = rbi1; plot ga2 = rbi2; plot ga3 = rbi3; plot ga4 = rbi4;
plot ga5 = rbi5; plot ga6 = rbi6; plot ga7 = rbi7; plot ga8 = rbi8;

#Look and Feel
ga1.assignValueColor( color.MAGENTA );
ga2.assignValueColor( color.PLUM );
ga3.assignValueColor( color.BLUE );
ga4.assignValueColor( color.CYAN );
ga5.assignValueColor( color.GREEN );
ga6.assignValueColor( color.YELLOW );
ga7.assignValueColor( color.DARK_ORANGE );
ga8.assignValueColor( color.RED );
ga1.hideTitle(); ga2.hideTitle(); ga3.hideTitle(); ga4.hideTitle();
ga5.hideTitle(); ga6.hideTitle(); ga7.hideTitle(); ga8.hideTitle();

#Cloud Plots
addCloud( if cloud == yes then ga1 else double.NaN, ga8, color.RED, color.BLACK );
addCloud( if cloud == yes then ga1 else double.NaN, ga7, color.DARK_ORANGE, color.BLACK );
addCloud( if cloud == yes then ga1 else double.NaN, ga6, color.YELLOW, color.YELLOW );
addCloud( if cloud == yes then ga1 else double.NaN, ga5, color.GREEN, color.GREEN );
addCloud( if cloud == yes then ga1 else double.NaN, ga4, color.BLUE, color.BLUE );
addCloud( if cloud == yes then ga1 else double.NaN, ga3, color.PLUM, color.PLUM );
addCloud( if cloud == yes then ga1 else double.NaN, ga2, color.MAGENTA, color.MAGENTA );
C-OPENING RANGE (OR) STUDY WITH A TWIST:
#hint:<b>Opening Range(OR) Study w/ a twist:</b>\n The twist consists of: <li>1. A definotion of two opening ranges e.g. 5 & 60 minutes <li>2. The OR or the post-OR portion of the day may be clouded showing the OR's high, low and the smaller-OR-average. <li>3. Dots indicate 10% levels of the two ORs. <li>4. A choice to show either today's OR only or also previous days' ORs.

input ORBegin = 0930;#hint ORBegin:The start of the smaller OR
input OREnd = 0935;#hint OREnd:The end of the smaller OR
input ShowTodayOnly = { default "No", "Yes"};#hint ShowTodayOnly:YES shows only today's OR plot
input ORBegin2 = 0930;#hint ORBegin2:The start of the larger OR
input OREnd2 = 1030;#hint OREnd2:The end of the larger OR
input ShadeOR = YES;#hint ShadeOR:Shades the opening range in lieu of after the opening range

def s = ShowTodayOnly;
def na = Double.NaN;
def ORActive = if SecondsTillTime(OREnd) > 0 and SecondsFromTime(ORBegin) >= 0 then 1 else 0;
def today = if s == 0 or GetDay() == GetLastDay() and SecondsFromTime(ORBegin) >= 0 then 1 else 0;

rec ORHigh = if ORHigh[1] == 0 or ORActive[1] == 0 and ORActive == 1 then high else if ORActive and high > ORHigh[1] then high else ORHigh[1];

rec ORLow = if ORLow[1] == 0 or ORActive[1] == 0 and ORActive == 1 then low else if ORActive and low < ORLow[1] then low else ORLow[1];

def ORWidth = ORHigh - ORLow;
def ORHA = if ORActive or today < 1 then na else ORHigh;
def ORLA = if ORActive or today < 1 then na else ORLow;
def O = ORHA - (ORHA - ORLA) / 2;
plot ORL = If (O == 0 , na, O);
ORL.SetDefaultColor(Color.YELLOW);
ORL.SetStyle(Curve.LONG_DASH);
ORL.SetLineWeight(3);

#====== The larger OR =========
def ORActive2 = if SecondsTillTime(OREnd2) > 0 and SecondsFromTime(ORBegin2) >= 0 then 1 else 0;
rec ORHigh2 = if ORHigh2[1] == 0 or ORActive2[1] == 0 and ORActive2 == 1 then high else if ORActive2 and high > ORHigh2[1] then high else ORHigh2[1];

rec ORLow2 = if ORLow2[1] == 0 or ORActive2[1] == 0 and ORActive2 == 1 then low else if ORActive2 and low < ORLow2[1] then low else ORLow2[1];

def ORWidth2 = ORHigh2 - ORLow2;

#======= Define all the plots ===========
plot ORH2 = if ORActive2 or today < 1 then na else ORHigh2;
plot ORL2 = if ORActive2 or today < 1 then na else ORLow2;
ORH2.SetDefaultColor(Color.GREEN);
ORH2.SetStyle(Curve.LONG_DASH);
ORH2.SetLineWeight(3);
ORL2.SetDefaultColor(Color.RED);
ORL2.SetStyle(Curve.LONG_DASH);
ORL2.SetLineWeight(3);

def TimeLine = if SecondsTillTime(OREnd2) == 0 then 1 else 0;
def pos = (ORH2 - ORL2) / 10;#The value for each 10% of the H-L range

plot d1 = If (TimeLine , ORH2, na);
plot d2 = If (TimeLine , ORH2 - ( pos * 2), na);
plot d3 = If (TimeLine , ORH2 - ( pos * 3), na);
plot d4 = If (TimeLine , ORH2 - ( pos * 4), na);
plot d5 = If (TimeLine , ORH2 - ( pos * 5), na);
plot d6 = If (TimeLine , ORH2 - ( pos * 6), na);
plot d7 = If (TimeLine , ORH2 - ( pos * 7), na);
plot d8 = If (TimeLine , ORH2 - ( pos * 8), na);
plot d9 = If (TimeLine , ORH2 - ( pos * 9), na);
plot d10 = If (TimeLine , (ORL2), na);
d1.SetPaintingStrategy(PaintingStrategy.POINTS);
d2.SetPaintingStrategy(PaintingStrategy.POINTS);
d3.SetPaintingStrategy(PaintingStrategy.POINTS);
d4.SetPaintingStrategy(PaintingStrategy.POINTS);
d5.SetPaintingStrategy(PaintingStrategy.POINTS);
d6.SetPaintingStrategy(PaintingStrategy.POINTS);
d7.SetPaintingStrategy(PaintingStrategy.POINTS);
d8.SetPaintingStrategy(PaintingStrategy.POINTS);
d9.SetPaintingStrategy(PaintingStrategy.POINTS);
d10.SetPaintingStrategy(PaintingStrategy.POINTS);
def Span = (O - ORL2) / (ORH2 - ORL2);

rec colorState = if Span > 0.66 then -1
else if Span < 0.33 then 1 else 0;

d1.AssignValueColor(if colorState < 0 then Color.RED else if colorState > 0 then Color.GREEN else Color.YELLOW);
d2.AssignValueColor(if colorState < 0 then Color.RED else if colorState > 0 then Color.GREEN else Color.YELLOW);
d3.AssignValueColor(if colorState < 0 then Color.RED else if colorState > 0 then Color.GREEN else Color.YELLOW);
d4.AssignValueColor(if colorState < 0 then Color.RED else if colorState > 0 then Color.GREEN else Color.YELLOW);
d5.AssignValueColor(if colorState < 0 then Color.RED else if colorState > 0 then Color.GREEN else Color.YELLOW);
d6.AssignValueColor(if colorState < 0 then Color.RED else if colorState > 0 then Color.GREEN else Color.YELLOW);
d7.AssignValueColor(if colorState < 0 then Color.RED else if colorState > 0 then Color.GREEN else Color.YELLOW);
d8.AssignValueColor(if colorState < 0 then Color.RED else if colorState > 0 then Color.GREEN else Color.YELLOW);
d9.AssignValueColor(if colorState < 0 then Color.RED else if colorState > 0 then Color.GREEN else Color.YELLOW);
d10.AssignValueColor(if colorState < 0 then Color.RED else if colorState > 0 then Color.GREEN else Color.YELLOW);
d1.SetLineWeight(5);d2.SetLineWeight(5);d3.SetLineWeight(5);d4.SetLineWeight(5);d5.SetLineWeight(5);
d6.SetLineWeight(5);d7.SetLineWeight(5);d8.SetLineWeight(5);d9.SetLineWeight(5);d10.SetLineWeight(5);

def TimeLineb = if SecondsTillTime(OREnd) == 0 then 1 else 0;
def posbd = (ORHA - ORLA) / 10;

plot bd1 = If (TimeLineb , ORHA, na); plot bd2 = If (TimeLineb , ORHA - ( posbd * 2), na);
plot bd3 = If (TimeLineb , ORHA - ( posbd * 3), na); plot bd4 = If (TimeLineb , ORHA - ( posbd * 4), na);
plot bd5 = If (TimeLineb , ORHA - ( posbd * 5), na); plot bd6 = If (TimeLineb , ORHA - ( posbd * 6), na);
plot bd7 = If (TimeLineb , ORHA - ( posbd * 7), na); plot bd8 = If (TimeLineb , ORHA - ( posbd * 8), na);
plot bd9 = If (TimeLineb , ORHA - ( posbd * 9), na); plot bd10 = If (TimeLineb , (ORL2), na);

bd1.SetPaintingStrategy(PaintingStrategy.POINTS); bd2.SetPaintingStrategy(PaintingStrategy.POINTS);
bd3.SetPaintingStrategy(PaintingStrategy.POINTS); bd4.SetPaintingStrategy(PaintingStrategy.POINTS);
bd5.SetPaintingStrategy(PaintingStrategy.POINTS); bd6.SetPaintingStrategy(PaintingStrategy.POINTS);
bd7.SetPaintingStrategy(PaintingStrategy.POINTS); bd8.SetPaintingStrategy(PaintingStrategy.POINTS);
bd9.SetPaintingStrategy(PaintingStrategy.POINTS); bd10.SetPaintingStrategy(PaintingStrategy.POINTS);
bd1.SetDefaultColor(Color.YELLOW); bd2.SetDefaultColor(Color.YELLOW); bd3.SetDefaultColor(Color.YELLOW);
bd4.SetDefaultColor(Color.YELLOW); bd5.SetDefaultColor(Color.YELLOW); bd6.SetDefaultColor(Color.YELLOW);
bd7.SetDefaultColor(Color.YELLOW); bd8.SetDefaultColor(Color.YELLOW); bd9.SetDefaultColor(Color.YELLOW);
bd10.SetDefaultColor(Color.YELLOW);

#========== To shade the opening active range =====================
def ORActive3= if GetLastDay() == GetDay() and SecondsFromTime(ORBegin2) >= 0 and SecondsFromTime(OREnd2)  <= 0 then 1 else 0;

def ORHigh3 = if ORActive3 then high else na;
def ORLow3 = if ORActive3 then low else na;

plot ORAH3 = if (GetLastDay() != GetDay() or !ORActive3) or !ShadeOR then na else HighestAll(ORHigh3);
plot ORAL3= if (GetLastDay() != GetDay() or !ORActive3) or !ShadeOR then na else LowestAll(ORLow3);

#========= end of To shad the opening active range ==================
#====== Shade option selection ==========
#AddCloud(ORL2, ORH2, color.downtick, color.downtick);#If ORShade = NO
#AddCloud(ORAL3, ORAH3,color.light_red,color.light_red);#If ORShade = YES
def Shade1 = If ShadeOR then  ORAL3  else ORL2;
def Shade2 = If ShadeOR then  ORAH3  else ORH2;

AddCloud(Shade1, shade2,color.light_red,color.light_red);
#======= end of Shade option selection ========

#========= labels ==============
AddLabel(yes, "OR Time = " +  ORBegin2 + " to " + AsPrice( OREnd2) + " and Smaller OR is " + AsPrice(ORBegin) + " to " +AsPrice(OREnd) , Color.PINK);

AddLabel(yes,"OR High = "+ ORH2 + " & OR Low = " + ORL2, color.pink);
C&S-THE MARKET FORECAST REPLICA
Comment:The reference for 'The Market Forecast' concept is www.themarketforecast.com/index.html
#hint:Plots a <b>replica of the builtin 'MarketForecast'</b> with labels added & colors altered\nThis replica provides parameters that can be used in a subsequent plot/scan to identify the powerful cluster concept.

declare lower;

#plot WhiteLabel = Double.NaN;
#WhiteLabel.SetDefaultColor(Color.White);

def na = Double.NaN;

Plot MidLine = 50;
MidLine.SetPaintingStrategy(PaintingStrategy.LINE);
MidLine.SetLineWeight(1);
MidLine.SetDefaultColor(Color.YELLOW);

plot Momentum = MarketForecast().Momentum;
Momentum.SetPaintingStrategy(PaintingStrategy.LINE);
Momentum.SetLineWeight(2);
Momentum.SetDefaultColor(Color.RED);

plot NearT =  MarketForecast().NearTerm;
NearT.SetPaintingStrategy(PaintingStrategy.LINE);
NearT.SetLineWeight(2);
NearT.SetDefaultColor(Color.CYAN);

plot Intermed = MarketForecast().Intermediate;
Intermed.SetPaintingStrategy(PaintingStrategy.LINE);
Intermed.SetLineWeight(2);
Intermed.SetDefaultColor(Color.upTICK);

Plot OB =80;
OB.SetPaintingStrategy(PaintingStrategy.LINE);
OB.SetLineWeight(1);
OB.SetDefaultColor(Color.YELLOW);

Plot OS = 20;
OS.SetPaintingStrategy(PaintingStrategy.LINE);
OS.SetLineWeight(1);
OS.SetDefaultColor(Color.YELLOW);

Plot upperLine = 110;
upperLine.SetDefaultColor(Color.BLUE);

AddLabel(yes, "Momentum = " + round(Momentum,1), Color.RED);
AddLabel(yes, "NearTerm = " +  round(NearT,1), Color.CYAN);
AddLabel(yes, "Intermediate = " +  round(Momentum,1), Color.UPTICK);
AddLabel(yes, "Sum Total = " +  round( Momentum + NearT + Intermed, 1), Color.PINK);
AddLabel(yes, "MOM+NEAR Total = " +  Round(Momentum + NearT,1), Color.PINK);
AddCloud (NearT, MidLine , color. green, color. red);
Comment:The following code plots when a cluster exists in the above code. A cluster is when all three plots are either above OB (80) or below OS (20). Clusters are powerful points for buy/sell decisions.
#Hint: <b>Plots when the market forecast high or low clusters are true.</b>\n When used as a scan, <b>EITHER</b> 'Plot Cluster_Hi' or 'Plot Cluster_Lo' need to be commented-out with #. When used as a plot the day agg is most meaningful

#Title = Cluster_TMF

declare lower;

def c1I = close - lowest(low,31);
def c2I = highest(high,31) - lowest(low,31);
def FastK_I = c1I / c2I * 100;
def c1N = close - lowest(low,3);
def c2N = highest(high,3) - lowest(low,3);
def FastK_N = c1N / c2N * 100;
def Intermediate = Average(FastK_I, 5);
def NearTerm = Average(FastK_N, 2);
def Momentum = reference marketforecast.Momentum;
def ClusterHigh = Intermediate>=80 && NearTerm>=80 && Momentum>=80 ;
def ClusterLow =  Intermediate<=20 && NearTerm<=20 && Momentum<=20;

#===== When used as a study plot,  all four lines below are active ========#
#===== When used as a scan, two of the four lines below are commented out depending on the scan desired =======#
Plot Cluster_Hi = if clusterhigh then 1 else 0;
Cluster_Hi.SetDefaultColor(Color.CYAN);

plot Cluster_Lo = if clusterlow then 1 else 0;
Cluster_Lo.SetDefaultColor(Color.PINK);

AddLabel(yes, "High Cluster above 80", color.CYAN);
AddLabel(yes, "Low Cluster below 20", color.PINK);
C-DRAW A LINE BETWEEN TWO PRICE POINTS
#Hint: Draws a line between to points defined by dates, times and price type
Developed by RCG3 and StanL on the ThinkScript Lounge 1/2/14
input time1 = 1000;#hint time1:Time of first point using the 24-hour clock
input date1 = 20140102;#hint date1:Date of the first point in YYYYMMDD format
input time2 = 1300;#hint time2: Time of second point using the 24-hour clock
input date2 = 20140102;#hint date2: Date of the first point in YYYYMMDD format
input price = high;#hint price: Select the price type desired

#====== To see dots on the inputted dates/times change the def below for

#===== 'asdf' and 'asdf2' to plot and uncomment the setpaintingstrategy =====

def asdf= secondsfromtime(time1) == 0;
#asdf.setpaintingstrategy(paintingstrategy.boolean_points);
def asdf2= secondsfromtime(time2) == 0;
#asdf2.setpaintingstrategy(paintingstrategy.boolean_points);
def date= getyyyymmdd();

rec x1= if secondsfromtime(time1) == 0 and date1==date then barnumber() else x1[1];
rec x2= if secondsfromtime(time2) == 0 and date2==date then barnumber() else x2[1];
rec y1= if secondsfromtime(time1) == 0 and date1==date then price else y1[1];
rec y2= if secondsfromtime(time2) == 0 and date2==date then price else y2[1];
def x22= highestall(x2);
def y22= highestall(y2);
def slope= (y22-y1)/(x22-x1);

#plot line= if x1!=0 then y1+((barnumber()-x1)*slope) else double.nan;
plot line= if x1!=0 and x2[1]==0 then y1+((barnumber()-x1)*slope) else double.nan;
def  Angle_deg = ATan(slope) * 180 / Double.Pi;

#addLabel(yes, "Slope = " +  Angle_deg + "degrees", color.CYAN);#Angle printout has no consistency at various aggs
#alert(price crosses line, "Price crossed trendline", alert.once,sound.chimes);# uncomment this line if used as a trendline
C-VOLUME LABEL AS A PERCENT OF AN INPUTTED X-DAYS-AVG-VOLUME
#hint:Shows a label stating the current day's volume as a percent of an inputted  X-days-AvgVolume

declare upper;

input Days = 30;#hint Days:The number-of-days average volume that is compared to today's volume

def AvgVol = RoundUp( Average(volume (period = AggregationPeriod.DAY), Days));
def TodaysVol = volume(period = ”DAY”);
def Percent = TodaysVol / AvgVol;#not a true % but is a ratio
def dayOpen = open(period = AggregationPeriod.DAY);
def curClose = close(period = AggregationPeriod.DAY);

#AddLabel(1, "Vol is " + aspercent(Percent) + " of " + Days + "-day-AvgVol", if Percent < .80 then Color.LIGHT_GRAY else Color.GREEN);#This is an optional label
AddLabel(1, "Vol is " + aspercent(Percent) + " of " + Days + "-day-AvgVol", if Percent <= .70 AND ( dayOpen < curClose or dayOpen > curClose ) then Color.LIGHT_GRAY else if (.80 >= Percent > .70) AND ( dayOpen < curClose or dayOpen > curClose ) then Color.YELLOW else if Percent > .80 AND dayOpen < curClose then Color.Green  else if Percent > .80 AND dayOpen > curClose  then Color.red else Color.WHITE );

#AddLabel(1,aspercent(Percent),if Percent <= .70 AND ( dayOpen < curClose or dayOpen > curClose ) then Color.LIGHT_GRAY else if (.80 >= Percent > .70) AND ( dayOpen < curClose or dayOpen > curClose ) then Color.YELLOW else if Percent > .80 AND dayOpen < curClose then Color.Green  else if Percent > .80 AND dayOpen > curClose  then Color.red else Color.WHITE );# This label may be used in a custom column

Comment1: This has all the ingredients for a custom column except the label text is too verbose for a column. The lower label is suitable for a custom column
T&C-EXAMPLES OF THE USAGE OF THE 'SUM' FUNCTION
The SUM function has some versatile usage as illustrated in the coding examples below.
Def Example1 = sum(low > Average(close, 21), 5) == 5;# Is true when the 21-bar-average-of-the-close exists (is true) for the last 5 consecutive bars.
def Example2 = Sum(MACDHistogramCrossover(), 8) ;#This plots the count of "Positive to Negative" crosses in the last 8 bars including the current bar.
The MACDHistogramCrossover() has a choice of "Positive to Negative" or "Negative to Positive". Using a reference without parameters specified, TS will use the default which is "Positive to Negative".
def Example2A = Sum(MACDHistogramCrossover(crossingType = "Negative to Positive"), 8) ;#This plots the count of "Negative to Positive" crosses in the last 8 bars including the current bar.
To change the above to a condition use:
def Example3 = Sum(MACDHistogramCrossover(), 8) >= 2;#If the count of "Positive to Negative" crosses in the last 8 bars is greater than or equal to 2, then Example3 evaluates to 'true' (or 1). Otherwise it is false (0).
Def Example4 = sum(close > close[1],5) >= 5;#Is true when the close has been rising (trending up) for the last 5 bars
Example 5: Uses sum to look for a divergence. Can be useful in a custom watchlist column. Here the MACD average is going up while the MACD itself is going down for the number of 'Bars'.
Input Bars = 3;
def macdAvg = MACD().Avg;
def macdValue = MACD();
def div = sum( macdAvg > macdAvg[1],Bars) == Bars ;#True if rising for the last 'Bars' bars
def div2 = sum( macdValue < macdValue[1],Bars) == Bars;#True if falling for the last 'Bars' bars
plot scan = div and div2;
Def Example6 = sum(close < close[1],5) == 5;# The has declined for the last 5 bars
Example 7 = A more flexible code having selectable price, length and direction (Choice).
input price = close;
input length = 3;
input Choice = {default "increased", "decreased"};

plot scan;

switch (Choice){
  case "increased":
    scan = sum(price > price[1], length) == length;
  case "decreased":
    scan = sum(price < price[1], length) == length;
}
Comment: If the above code was in a saved study named 'MyPriceTrend', you would run it by entering the following code in the custom scan location. This procedure is applicable for all saved custom studies.
Plot scan = reference MypriceTrend(Price = hlc3, length = 7, choice = "increased");
Note that 'hlc3' may be any parameter such as open, hugh, low, hl2, volume, etc. Be sure to set the time aggregation you desired i.e. 5 min, hour, day, etc.
Def Example 8: The following code is used to scan for stocks having future earnings.
Input length = 10;#Hint length:The number of future/ahead agg-bars to look in
def earnings = hasearnings();#When true this evaluates to one which then appears in the following 'sum'

plot scan = sum(earnings,length)[-length +1] > 0;# Will return all stocks having earnings within the next 10 days.
Def Example 9
#hint: <b>Market Sentiment</b>\nThe Market Sentiment study is a popular study on Prophet Charts.

declare lower;

input period1 = 51;
input period2 = 47;
input RoundingValue = 4;

def LowLow = Lowest(low, period1);
def Close_LowLow_Diff = close - LowLow;
def Hi_Hi = Highest(high, period2);
def HH_LL_Diff = Hi_Hi - LowLow;
def numerator = Sum(Close_LowLow_Diff, period2);
def denominator = Sum(HH_LL_Diff, period1);

plot MarketSentiment = round(100* (numerator/denominator), RoundingValue);
marketsentiment.setDefaultColor(color.yellow);
Example 10 #hint:High correlation scan
input length = 10;#hint length: the agg-bar length being compared
input correlationWithSecurity = "SPX";#hint  correlationWithSecurity; The security that the stock is correlated with
input inarow = 10;#hint inarow:The number of agg-bars in a row with >0.9 correlation

def x = Correlation(close, close(correlationWithSecurity), length) > =.9;#greater then 0.9 indicates a high correlation
plot scan = sum(x, inarow) >= inarow;# Returns stocks whose 10-bar-close have a greater than or equal to .9 correlation with SPX  for the last 10 (inarow) bars.
Example 11 #hint: Uses the DMI to scan the up-trending ADX
def length = 5;# The numbers of agg-bars DMI is climbing
def x =DMI_Oscillator();
def up = x > x[1];

Plot Scan = x > 10 && sum(up,length) >= length;# This returns stocks whose DMI_Oscillator value is greater than +10 and has been up for the last 5 bars. The DMI is the driving force behind the ADX, so this is equivalent to the bullish ADX trending up for the last 5 bars.
Example 12 # by Pacodeveux in Mr. Script show
#hint:Fast, med, slow true range osc
declare lower;
input fastLength = 7;
input medLength = 14;
input slowLength = 28;
input FactorFast = 4;
input FactorMed = 2;
input FactorSlow = 1;

def trRng = TrueRange(high, close, low);
def trRngFast = sum(trRng, fastLength);
def trRngMed = sum(trRng, medLength);
def trRngSlow = sum(trRng, slowLength);
def diff = close - Min(close[1], low);
def diffFast = sum(diff, fastLength);
def diffMed = sum(diff, medLength);
def diffSlow = sum(diff, slowLength);
def valFast = (diffFast / trRngFast) * factorFast;
def valMed = (diffMed / trRngMed) * factorMed;
def valSlow = (diffSlow / trRngSlow) * FactorSlow;

Plot midLine = 0.5;
midLine.SetLineWeight(2);
midLine.SetDefaultColor(Color.yellow);

plot UltOsc = if trRngFast == 0 or trRngMed == 0 or trRngSlow == 0 then 0
else (valFast + valMed + valSlow) / (factorFast + factorMed + 1);
UltOsc.SetDefaultColor(GetColor(1));

AddLabel(1,”Fast-Med-Slow True Range Oscillator”, color.white);
Example 13 #hint:Projection bands are narrowing for 5 bars
def pro = projectionBands();
def prol = ProjectionBands().MinBound;
def cond = pro - prol < pro[1] - prol[1];

plot scan = sum(cond,5) >= 5;# Returns stocks whose projrction bands have been narrowing for the last 5 bars
Example 14 # Hint: Plots consecutive higher-highs AND lower-lows
input price = close;
input number = 3;#hint number: Arrows are plotted after this number of consecutives are observed

def hi = high;
def lo = low;
def higher = if hi > hi[1] then hi else higher[1];
def lower = if lo < lo[1] then lo else lower[1];

plot h = higher;
h.SetLineWeight(1);
h.SetDefaultColor(Color.cyan);
plot l =lower;
l.SetLineWeight(1);
l.SetDefaultColor(Color.pink);
def hig = higher > higher[1];
def lowe = lower < lower[1];

plot x = sum(hig,number) >= number;# Plots an arrow down when a higher high exists for 3 (number) bars.
x.setPaintingStrategy(paintingStrategy.BOOLEAN_ARROW_DOWN);
x.SetLineWeight(1);
x.SetDefaultColor(Color.White);

plot y = sum(lowe,number) >= number;# Plots an arrow up when a lower low exists for 3 (number) bars.
y.setPaintingStrategy(paintingStrategy.BOOLEAN_ARROW_UP);
y.SetLineWeight(1);
y.SetDefaultColor(Color.yellow);

AddLabel(1,"Plot of highs", color.cyan);
AddLabel(1,"Plot of lows", color.pink);
AddLabel(1,"Plot arrows of higher-highs", color.white);
AddLabel(1,"Plot arrows of lower-lows", color.yellow);
Example 15 #Scan for stocks with the consecutive number of higher-highs(plot scan1) or lower-lows (plot scan2)
input price = close;
input number = 7;#hint number: The number of consecutive bars

def hi = high;
def lo = low;
def higher = if hi > hi[1] then hi else higher[1];
def lower = if lo < lo[1] then lo else lower[1];
def hig = higher > higher[1];
def lowe = lower < lower[1];

plot scan1 = sum(hig,number) >= number;#returns stocks that have a higher high for the last 7 (number) bars
#plot scan2 = sum(lowe,number) >= number;#returns stocks that have a lower low for the last 7 (number) bars
Example 16 #HINT: scan filter that searches for up-trending symbols
def trenup = IsAscending(close,20);#Close has been rising for 20 bars
def trenup2 = sum(close > close[1],5) >= 5;#Close has risen for the last 5 bars
plot scan = trenup AND trenup2;
C-HOW TO SHOW WHEN A CANDLE PATTERN EXISTS ON A CHART
One basic principle is that when you state for, example Doji(), when a doji is present Doji() returns 'true'. So to display the presence of a Doji on your chart you code it as :
Plot data = Doji();
Data.SetPaintingStrategy(PaintingStrategy.ARROW_UP);
Data.SetLineWeight(1);
Data.SetDefaultColor(Color.PINK);
Another point to remember is that some candles are both bearish and bullish. If you do nt distinguish which you want like Harami() the default bearish Harami will be returned. To be thorough and clear, you ought to code Harami().Bearish or Harami().Bullish instead depending on what you desire. A Doji() is neither bearish nor bullish so Doji() is used alone.
C-DUAL SPEED STOCHASTICS
Comments from donor BDPonydoc on Yahoo Groups #(18563)
Title = My Favorite Indicator
"Here is the code for my favorite indicator. It is an overbought oversold indicator that I use on just about everything. I think the settings I use are the best ones, I have tried different values over the last several years, but these seem to work the best across all time frames. The best major signal come when the two oscillators line up. Plot it on a stock daily chart and a 5 min futures chart and I think you will get the picture. On my 3 minute or 5 minutes futures charts, I use the same settings except for one, the second to the last choice for slowing period1 I use 9 instead of 24. It provides a more responsive Stochastic for day trading.
Comment: Although there are many stochastis studies out there, this one looked very useful. It is similar to the Market Forecast. A powerful signal is present when both speeds are simultaneously below OS or above OB.
#TOS Title = "DualStochasticForecast"
#hint:<b>Dual speed stochastics</b>\nLook for both speeds being coincident at below the over-sold or above the over- bought and for multi-aggs.\nArrows are plotted at the OS and OB crossings

declare lower;

def price = (high + low) / 2;

input over_bought = 90;
input over_sold = 10;
input length = 26;#hint length:For the faster stoch.Recommended default is 26
input KPeriod = 13;#hint KPeriod:For the faster stoch. Recommended default is 13
input DPeriod = 9;#hint DPeriod:For the faster stoch. Recommended default is 9
input slowing_period = 9;#hint slowing_period:For the faster stoch. Recommended default is 9
input smoothingType = 1;#hint smoothingType:For the faster stoch. Recommended default is 1
input DTSell = 95;
input DTBuy = 5;

plot WhiteLabel = Double.NaN;

WhiteLabel.SetDefaultColor(Color.White);

def NetChgAvg = WildersAverage(price - price[1], length);
def TotChgAvg = WildersAverage(AbsValue(price - price[1]), length);
def ChgRatio = if TotChgAvg != 0 then NetChgAvg / TotChgAvg else 0;
def RSI = 50 * (ChgRatio + 1);
def c1 = RSI - Lowest(RSI, KPeriod);
def c2 = Highest(RSI, KPeriod) - Lowest(RSI, KPeriod);
def FastK = c1 / c2 * 100;

plot FullK;
plot FullD;

if smoothingType == 1
then {
  FullK = Average(FastK, slowing_period);
  FullD = Average(FullK, DPeriod);
} else {
  FullK = ExpAverage(FastK, slowing_period);
  FullD = ExpAverage(FullK, DPeriod);
}

FullK.SetPaintingStrategy(PaintingStrategy.LINE);
FullK.SetLineWeight(2);
FullK.SetDefaultColor(Color.RED);
FullD.SetPaintingStrategy(PaintingStrategy.LINE);
FullD.SetLineWeight(1);
FullD.SetDefaultColor(Color.YELLOW);

#=== plot min arrows for FullK (fast)====
def cond1 = if crosses(FullK,Over_Sold,CrossingDirection.any) then 1 else 0;
Plot Min_Fast = if cond1 then FullK else double.nan;
Min_Fast.SetPaintingStrategy(PaintingStrategy.ARROW_DOWN);
Min_Fast.SetLineWeight(4);
Min_Fast.SetDefaultColor(Color.RED);

#=== plot max arrows for FullK (fast)====
def cond3 = if crosses(FullK,over_Bought,CrossingDirection.any) then 1 else 0;
Plot Max_Fast = if cond3 then FullK else double.nan;
Max_Fast.SetPaintingStrategy(PaintingStrategy.ARROW_UP);
Max_Fast.SetLineWeight(4);
Max_Fast.SetDefaultColor(Color.RED);

#========================================
plot OverBought = over_bought;
OverBought.SetDefaultColor(Color.CYAN);

plot OverSold = over_sold;
OverSold.SetDefaultColor(Color.CYAN);
#FullK.SetDefaultColor(GetColor(5));
#FullD.SetDefaultColor(GetColor(0));
OverBought.SetDefaultColor(GetColor(1));
OverSold.SetDefaultColor(GetColor(1));

#
# thinkorswim, inc. (c) 2008
#    Stochastics

input KPeriod1 = 48;#hint KPeriod1:For slower stoch. Recommended default is 48
input DPeriod1 = 12;#hint DPeriod1:For slower stoch. Recommended default is 12
input priceH = high;
input priceL = low;
input priceC = close;
input slowing_period1 = 24;#hint slowing_period1:For slower stoch. Recommended default is 24 but use 9 for 3-mi and 5-min charts
input smoothingType1 = 3;#hint smoothingType1:For slower stoch. Recommended default is 3

def c11 = priceC - Lowest(priceL, KPeriod1);def c21 = Highest(priceH, KPeriod1) - Lowest(priceL, KPeriod1);
def FastK1 = c11 / c21 * 100;

plot FullK1;
plot FullD1;
if smoothingType1 == 1
then {
  FullK1 = Average(FastK1, slowing_period1);
  FullD1 = Average(FullK1, DPeriod1);
} else {
  FullK1 = ExpAverage(FastK1, slowing_period1);
  FullD1 = ExpAverage(FullK1, DPeriod1);
}

FullK1.SetPaintingStrategy(PaintingStrategy.LINE);
FullK1.SetLineWeight(2);
FullK1.SetDefaultColor(Color.GREEN);
FullD1.SetPaintingStrategy(PaintingStrategy.LINE);
FullD1.SetLineWeight(1);
FullD1.SetDefaultColor(Color.YELLOW);

############################################
#=== plot min arrows for FullK1 (Slow)====
def cond2 = if crosses(FullK1,Over_Sold,CrossingDirection.any) then 1 else 0;
Plot Min_Slow = if cond2 then FullK1 else double.nan;
Min_Fast.SetPaintingStrategy(PaintingStrategy.ARROW_DOWN);
Min_Fast.SetLineWeight(4);
Min_Fast.SetDefaultColor(Color.GREEN);

#=== plot max arrows for FullK1 (slow)====
def cond4 = if crosses(FullK1,over_Bought,CrossingDirection.any) then 1 else 0;
Plot Max_Slow = if cond4 then FullK1 else double.nan;
Max_Slow.SetPaintingStrategy(PaintingStrategy.ARROW_UP);
Max_Slow.SetLineWeight(4);
Max_Slow.SetDefaultColor(Color.GREEN);

#========================================
Alert(Crosses(FullK, 5, CrossingDirection.ABOVE), "DT OSC Buy", Alert.ONCE, Sound.Ding);
Alert(Crosses(FullK, 95, CrossingDirection.BELOW), "DT OSC Sell", Alert.ONCE, Sound.Ding);
Plot Mid_line = 50;
Mid_line.SetPaintingStrategy(PaintingStrategy.DASHES);
Mid_line.SetLineWeight(1);
Mid_line.SetDefaultColor(Color.YELLOW);


plot StochBuy = If(Crosses(FullK1 or FullD1, 10, CrossingDirection.ABOVE), low, Double.NaN);
StochBuy.SetPaintingStrategy(PaintingStrategy.BOOLEAN_ARROW_UP);

plot StochSell = If(Crosses(FullK1 or FullD1, 90, CrossingDirection.BELOW) , high, Double.NaN);
StochSell.SetPaintingStrategy(PaintingStrategy.BOOLEAN_ARROW_DOWN);

plot DTBuylevel = DTBuy;
DTBuylevel.SetDefaultColor(Color.YELLOW);

plot DTSelllevel = DTSell;
DTBuylevel.SetDefaultColor(Color.YELLOW);

addlabel(1,"Dual speed stoch", color.pink);
addlabel(1,"FASTER Stoch",color.RED);
addlabel(1,"SLOWER Stoch",color.GREEN);

Plot Label_Line = 105;

Label_Line.setDefaultColor(color.CURRENT);
C-TODAY’S DJI OR ANY STOCK STATUS LABEL
#hint:Today's Dow Jones Industrial status. Any symbol may be substituted for the DJI. If you enter a futures symbol for the label while showing a stock chart, the label functions normally during stock trading hours but should be used along with a futures chart during stock-trading-off-hours. Use multiple instances to monitor additional stocks.

input symbol = "$DJI";#Hint symbol:Enter in cap letters to improve looks of the label

def C_now = close(Symbol);
def c = close(symbol, period = AggregationPeriod.day)[1];
def Change = (C_now/c - 1);
Def value_change = C_now - c;
Def PctChange = Change * 100;
Def Up_Dwn_cond = if (c_now < C, 1 , 0);

AddLabel(1, Symbol + " now = " + round(c_now,2) ,Color.PINK);
AddLabel(Up_Dwn_cond,"DOWN", color.RED);
AddLabel(!Up_Dwn_cond,"UP", color.GREEN);
Addlabel(1,"Change = " + round(value_change,2) + " (" + round(PctChange,2) + "%)", if Up_Dwn_cond then Color.RED else Color.GREEN);
#AddLabel(1, "C_now = " + C_now, color.PINK);
#AddLabel(1, "Close of previous day = " + c,color.PINK);
C-PLOT SUPPORT AND RESISTANCE LINES
#created by Richard Houser, tos_thinkscript@yahoogroups 11-16-12
#hint:Show support/resistance lines based on an inputted-number-of-bars (markPeriod).\n You can adjust the agg to suit your style but 'day' is very meaningful. \nThe support and resistance lines are generated based on a swing-high/swing-low concept.
# Keep in mind too few days and you'll get a bunch of false s/r lines. Too many days and
# you'll miss some number of s/r days. Five days is a good floor to start. Also note that the right hand bubble value only show for the full S/R and not the intermedite S/R lines.
#A new support line starts at the lowest-low of the input period when both:
#1. the current bar is the lowest of the last markPeriod and
# 2. the lowest-low of the markPeriod is less than that at the markPeriod-in-the-future
# are true: In essence forms a V shape. The resistance lines are formed the same but inverted.

declare upper;

input markPeriod    = 5;#hint markPeriod:The number of bars used in the evaluation of when a new support/resistance line starts i.e. the PERIOD

input upperPerCent  = 70.0;#hint upperPerCent:Applied to the spread to define the upper intermediate resistance
input lowerPerCent  = 30.0;#hint lowerPerCent:Applied to the spread to define the lower intermediate support

def _highInPeriod   = Highest( high, markPeriod );#The highest high in the markperiod i.e. the PERIOD
def _lowInPeriod    = Lowest( low, markPeriod );#The lowest value in the markperiod i.e. the PERIOD

#=============================[ Marked Low ]===================================
def marketLow       = if _lowInPeriod < _lowInPeriod[-markPeriod] then _lowInPeriod else _lowInPeriod[-markPeriod];
def _markedLow      = low == marketLow;

#=== below saves the marked low for plotting the support line ======
rec _lastMarkedLow  = compoundValue( 1, if IsNaN( _markedLow ) then _lastMarkedLow[1] else if _markedLow then low else _lastMarkedLow[1], low ) #============================[ Marked High ]===================================
def marketHigh      = if _highInPeriod > _highInPeriod[-markPeriod] then _highInPeriod else _highInPeriod[-markPeriod];
def _markedHigh     = high == marketHigh;

#=== below saves the marked high for plotting the resistance line ======
rec _lastMarkedHigh = compoundValue( 1, if IsNaN( _markedHigh ) then _lastMarkedHigh[1] else if _markedHigh then high else _lastMarkedHigh[1], high );

#==================================[ Plots ]===================================
plot Resistance     = _lastMarkedHigh;
plot Support        = _lastMarkedLow;
def spread          = Resistance - Support;
plot IntermediateResistance = Support + ( spread * upperPercent / 100 );
plot IntermediateSupport    = Support + ( spread * lowerPercent / 100 );

#==============================[ Look and Feel ]===============================
Resistance.SetPaintingStrategy( PaintingStrategy.HORIZONTAL );
Resistance.SetDefaultColor( Color.cyan );
Resistance.SetLineWeight(3);
Support.SetPaintingStrategy( PaintingStrategy.HORIZONTAL );
Support.SetDefaultColor( Color.red );
Support.SetLineWeight(3);
IntermediateResistance.SetPaintingStrategy( PaintingStrategy.HORIZONTAL);
IntermediateResistance.SetDefaultColor( Color.Cyan );
IntermediateResistance.HideBubble();
IntermediateResistance.SetLineWeight(1);
IntermediateSupport.SetPaintingStrategy( PaintingStrategy.HORIZONTAL);
IntermediateSupport.SetDefaultColor( Color.RED );
IntermediateSupport.HideBubble();
IntermediateSupport.SetLineWeight(1);
C- IMP_VOLATILITY() PERCENTILE PLOT WITH LABELS
Comment: This code received a lot of attention and discussion on TastyTrade’s 'Game Changers'.
#####Begin study: n2s_IVRank_SD
#hint: From TastyTrade. Plots IV Percentile with the following labels: long-term IV Rank, short-term IV Rank, Imp Vol, and expected SD moves for 1 day, 1 week, and 1 month.
# from TastyTrade Game Changers 12/19/13
# modified by John Latrobe 12/20/13

declare lower;
declare hide_on_intraday;

#IVPercentile
def vol = imp_volatility();

input DisplayIVPercentile = yes;
input TimePeriod = 252;
input LowVolLimit = 20;
input HighVolLimit = 70;
input DisplayShorterTerm = yes;
input ShortTimePeriod = 63;
input DisplayImpVolatility= yes;
input DisplayDaily1StandardDev = yes;
input DisplayWeekly1StandardDev = yes;
input DisplayMonthly1StandardDev = yes;
input InvertRedGreen = yes;

def data = if !isNaN(vol) then vol else vol[-1];
def hi = highest(data, TimePeriod);
def lo = lowest(data, TimePeriod);
def ShortHi = highest(data, ShortTimePeriod);
def ShortLo = lowest(data, ShortTimePeriod);

plot Percentile = (data - lo) / (hi - lo) * 100;
def lowend = Percentile < LowVolLimit;
def highend = Percentile > HighVolLimit;
def sPercentile = (data - ShortLo) / (ShortHi - ShortLo) * 100;
def ShortLowend = sPercentile < LowVolLimit;
def ShortHighend = sPercentile > HighVolLimit;

DefineGlobalColor("lowcolor", if InvertRedGreen then color.green else color.red);
DefineGlobalColor("Shortlowcolor", if InvertRedGreen then color.green else color.red);
DefineGlobalColor("highcolor", if InvertRedGreen then color.red else color.green);
DefineGlobalColor("Shorthighcolor", if InvertRedGreen then color.red else color.green);

#Labels
addlabel(DisplayIVPercentile , concat("Long IV Rank: ",aspercent(round(Percentile /100, 2))), if lowend then GlobalColor("lowcolor") else if highend then GlobalColor("highcolor") else color.yellow);

addlabel(DisplayShorterTerm , concat("Short IV Rank: ",aspercent(round(sPercentile /100, 2))), if shortlowend then GlobalColor("Shortlowcolor") else if shorthighend then GlobalColor("Shorthighcolor") else color.yellow);

addlabel(DisplayImpVolatility, concat("ImpVol: ",aspercent(vol)), if lowend then GlobalColor("lowcolor") else if highend then GlobalColor("highcolor") else color.yellow);

def ImpPts = (vol / Sqrt(252)) * close;

AddLabel(DisplayDaily1StandardDev , Concat("1Dy SD +/- $", Astext( ImpPts, NumberFormat.TWO_DECIMAL_PLACES)), if lowend then GlobalColor("lowcolor") else if highend then GlobalColor("highcolor") else color.yellow);

def ImpPts2 = (vol / Sqrt(52)) * close;

AddLabel(DisplayWeekly1StandardDev, Concat("1Wk SD +/- $", Astext( ImpPts2, NumberFormat.TWO_DECIMAL_PLACES)), if lowend then GlobalColor("lowcolor") else if highend then GlobalColor("highcolor") else color.yellow);

def ImpPts3 = (vol / Sqrt(12)) * close;

AddLabel(DisplayMonthly1StandardDev, Concat("1Mo SD +/- $", Astext( ImpPts3, NumberFormat.TWO_DECIMAL_PLACES)), if lowend then GlobalColor("lowcolor") else if highend then GlobalColor("highcolor") else color.yellow);

plot LowVol = LowVolLimit;
plot HighVol = HighVolLimit;
LowVol.SetDefaultColor(GetColor(6));
HighVol.SetDefaultColor(GetColor(5));
C-DMI_OSCILLATOR WITH ARROWS AND LINES
#hint:The popular builtin <b>DMI_Oscillator with arrows and lines</b> in positive and negative levels based on inputs. Use the lines and arrows to define your criteria/decision points.

declare lower;

input length = 10;#hint length:The number of bars with which the DI+ and DI- components are calculated.
#input paintBars = yes;#hint paintBars:Defines whether or not to color price plot according to respective oscillator values (red for negative, green for positive).
input CrossAboveValue = 10;#hint CrossAboveValue:Defines the above-zero-value at which an arrow is plotted.
input CrossBelowValue = 5;#hint CrossBelowValue:Defines the below-zero-value at which an arrow is plotted.

def diPlus = DMI(length)."DI+";
def diMinus = DMI(length)."DI-";

plot Osc = diPlus - diMinus;
plot Hist = Osc;
Osc.SetDefaultColor(GetColor(1));
Hist.SetPaintingStrategy(PaintingStrategy.HISTOGRAM);
Hist.SetLineWeight(3);
Hist.DefineColor("Positive", Color.UPTICK);
Hist.DefineColor("Negative", Color.DOWNTICK);
Hist.AssignValueColor(if Hist > 0 then Hist.Color("Positive") else Hist.Color("Negative"));
Hist.HideTitle();

plot ZeroLine = 0;
ZeroLine.SetDefaultColor(Color.YELLOW);

#plot line_5above = 5;
#line_5above.SetDefaultColor(Color.YELLOW);
plot line_10above = CrossAboveValue;
line_10above.SetDefaultColor(Color.YELLOW);

#plot line_5below = -5;
#line_5below.SetDefaultColor(Color.YELLOW);
plot line_10below = - CrossBelowValue;
line_10below.SetDefaultColor(Color.YELLOW);
ZeroLine.SetDefaultColor(Color.GRAY);

DefineGlobalColor("Positive", Color.UPTICK);
DefineGlobalColor("Negative", Color.DOWNTICK);

AssignPriceColor(if yes then Color.CURRENT else if Osc > 0 then GlobalColor("Positive") else GlobalColor("Negative"));

#======== Arrow plots when crossing input values ==========
def Up_Cross = if osc crosses above CrossAboveValue then 1 else 0;

Plot D_Up_Cross = if Up_Cross then osc else double.nan;
D_Up_Cross.SetPaintingStrategy(PaintingStrategy.ARROW_DOWN);
D_Up_Cross.SetLineWeight(1);
D_Up_Cross.SetDefaultColor(Color.GREEN);

AddLabel(1,"Above-zero arrow value = " + CrossAboveValue, color.GREEN);
def Down_Cross = if osc crosses below -CrossBelowValue then 1 else 0;

Plot D_Down_Cross = if Down_Cross then -CrossBelowValue else double.nan;
D_Down_Cross.SetPaintingStrategy(PaintingStrategy.ARROW_UP);
D_Down_Cross.SetLineWeight(1);
D_Down_Cross.SetDefaultColor(Color.RED);

AddLabel(1,"Below-zero arrow value = minus " + (CrossBelowValue), color.RED);
C-MINUTES-AGO SINCE A TURN-UP OF A MOVING AVERAGE
Comment 1: It frequently happens that a stock advances and then pauses before continuing to rise some more. This pattern has often been referred to as a 'bull flag' or 'bull pennant'. That scenario gave rise to a request for a custom column that tells the minutes since a stock made a turn up. This code was developed to show the minutes-ago that the stock started to turn up. Realize that the 'minutes-ago' will be different for each aggregation. This code can be used by having two custom columns with different aggregations like 5-mins and 15-mins. The user found those time differences between the two custom columns pertinent in his decision making. Note that every custom column has an aggregation that is set to your desires.
Comment 2: As a coding note, since the desired result was in minutes in lieu of bars, a 'bars-X-factor = minutes' had to be established for each aggregation. The numerous 'getAggregationPeriod() ==' lines are to define such a factor.
#hint:<b>A WLC that shows the minutes-ago since the last turn of the moving average either up or down.</b>\nFor comparison, you may create duplicate copies of this WLC with their own names and desired aggregations. The exclusion of extended hours is recommended.\nSet the Aggregation to the desired value with proper name to ID it. \nLabels show the number of bars that correlate with the column's minutes-ago.

declare lower;

input price           = close;#hint price: The price component being mearured
input fastLength      = 2;#Hint fastLength: A very short length used as a reference for the turn-up of the slower MA
input fastMvaType     = AverageType.SIMPLE;#hint fastMvaType: The type of MovAvg of the fast reference average.
input slowLength      = 30;#hint slowLength:The length of the main slow MovingAverage
input slowMvaType     = AverageType.SIMPLE;#hint slowMvaType: The type of MovAvg of the main slow Moving Average
def fastMva           = MovingAverage( fastMvaType, price, fastLength );
def slowMva           = MovingAverage( slowMvaType, price, slowLength );
def Histogram        = fastMva - slowMva;

#===== Define conditions to count up & down bars ==========
Def IsUp = If Histogram > 0 then 1 else 0;
Def IsDown = If Histogram < 0 then 1 else 0;
Rec count_downs = compoundvalue(1,if isdown then count_downs[1] + 1 else 0 ,0);
Rec count_ups = compoundvalue(1,if isup then count_ups[1] + 1 else 0,0);

#===== Define the bars-to-minutes factor ===========
Def Factor =  if getAggregationPeriod() == AggregationPeriod.MIN then 1 else if
  getAggregationPeriod() == AggregationPeriod.TWO_MIN then 2 else if
  getAggregationPeriod() == AggregationPeriod.THREE_MIN then 3 else if
  getAggregationPeriod() == AggregationPeriod.FOUR_MIN then 4 else if
  getAggregationPeriod() == AggregationPeriod.FIVE_MIN then 5 else if
  getAggregationPeriod() == AggregationPeriod.TEN_MIN then 10 else if
  getAggregationPeriod() == AggregationPeriod.FIFTEEN_MIN then 15 else if
  getAggregationPeriod() == AggregationPeriod.TWENTY_MIN then 20 else if
  getAggregationPeriod() == AggregationPeriod.THIRTY_MIN then 30 else if
  getAggregationPeriod() == AggregationPeriod.HOUR then 60 else if
  getAggregationPeriod() == AggregationPeriod.TWO_HOURS then 120 else if
  getAggregationPeriod() == AggregationPeriod.FOUR_HOURS then 240 else if
  getAggregationPeriod() == AggregationPeriod.DAY then 1440 else if
  getAggregationPeriod() == AggregationPeriod.TWO_DAYS then 2880 else if
  getAggregationPeriod() == AggregationPeriod.THREE_DAYS then 4320 else if
  getAggregationPeriod() == AggregationPeriod.FOUR_DAYS then 5750 else if
  getAggregationPeriod() == AggregationPeriod.WEEK then 7200 else if
  getAggregationPeriod() == AggregationPeriod.MONTH then 28800
  else double.nan;

#========
Def MinsSinceTurn = if count_downs == 0 then count_Ups * factor else if count_Ups == 0 then count_Downs * factor else 0 ;
Plot Data_MST = MinsSinceTurn;
Data_MST.setdefaultcolor(color.YELLOW);

AssignBackgroundColor(if count_Ups > 0 then color.dark_green else if count_downs > 0 then color.dark_RED else color.current);
#AddLabel(count_ups <> 0," The current number of " + factor + "-min-UP-bars = " + count_Ups,color.green);
#AddLabel(count_downs <> 0," The current number of " + factor + "-min-DOWN-bars = " + count_Downs,color.RED);
C-CODE FOR DAY-OF-THE-WEEK
For coding related to the day of week (Monday, Tuesday, etc.) see an example under 'VERTICAL LINES (3 STUDIES)'.
C- NORMALIZED MACD AND STOCHASTIC PLOTTED WITH A SQUEEZE INDICATION
#Normalized MACD, Stochastic
# Conditions and Squeeze indicator on the Zero Line
# by Mobius at MyTrade. Labels & clarifications by StanL

declare lower;

script normalizePlot {
  input data = close;
  input newRngMin =  -1;
  input newRngMax = 1;

  def hhData = HighestAll( data );
  def llData = LowestAll( data );

  plot nr = ((( newRngMax - newRngMin ) * ( data - llData )) / ( hhData - llData )) + newRngMin;
}

input fastEMA = 13;
input slowEMA = 21;
input Smooth  =  8;
input MacdWaveC = 50;
input nK = 10;
input nD = 3;
input nVP = 21;
input UpperLine = 30;
input LowerLine = -30;

def data   = close;

#======== Coloring the info header text ===========
plot WhiteLabel = Double.NaN;
WhiteLabel.SetDefaultColor(Color.White);

#==============================================
# VWAP Calculations
def v = volume;
def p = close;
def n = 5;
def vwap = Sum((p * v), n) / Sum(v, n);

#MACD Normalization script
script MACD{
  input fastEMA = 13;
  input slowEMA = 21;
  input Smooth  =  8;
  input value = close;

  def FSignal = (value * .15) +  (.85  * ExpAverage(value, fastEMA)[1]);
  def SSignal = (value * .075) + (.925 * ExpAverage(value, slowEMA)[1]);
  def MACD    = FSignal - SSignal;

  plot MACDSL  = ExpAverage(MACD, Smooth);
}

#Stochastic normalization script
script Stochastic{
  input nK = 10;
  input nD = 3;
  input value = close;

  def l = low;
  def h = high;
  def Data = 100 * ((value - Lowest(l, nK)) / (Highest(h, nK) - Lowest(l, nK)));
  def K = Inertia(Data, nK);

  plot D = ExpAverage(K, nD);
}

#========== the normalized MACD & Stochastic =============
def newMACD = normalizePlot( MACD("fastEMA" = fastEMA, "slowEMA" = slowEMA, "Smooth" = Smooth, "Value" = vwap), -100, 100 );
def newStochastic = normalizePlot( Stochastic("value" = vwap, "nK" = nK, "nD" = nD ), -50, 50 );

plot MACD = newMACD;
plot Stoch = newStochastic;
plot os = if isNaN(close) then Double.NaN else LowerLine;
os.SetPaintingStrategy(PaintingStrategy.LINE);
os.SetLineWeight(1);
os.SetDefaultColor(Color.WHITE);

plot ob = If IsNaN(close) then Double.NaN else UpperLine;
ob.SetPaintingStrategy(PaintingStrategy.LINE);
ob.SetLineWeight(1);
ob.SetDefaultColor(Color.WHITE);

plot ml = If  isNaN(close) then Double.NaN else 0;
ml.SetPaintingStrategy(PaintingStrategy.DASHES);
ml.SetLineWeight(1);
ml.SetDefaultColor(Color.WHITE);

#BB KC Squeeze
def Avg = Average(close, 20);
def stDeviation = stDev(close, 20);
def ATR = Average(TrueRange(high, low, close), 20);
def upperBB = Avg + (2 * stDeviation);
def upperKC = Avg + (1.5 * ATR);
def Squeeze = If upperBB < upperKC then yes else Double.NaN;

#Chart Management
#Plots

MACD.SetPaintingStrategy(PaintingStrategy.Histogram);
MACD.AssignValueColor(if MACD >= 50 and MACD > MACD[1] then Color.GREEN
else if MACD >= 50 and MACD < MACD[1]
then Color.RED
else if MACD <= 50 and MACD < MACD[1]
then Color.RED
else Color.DARK_GREEN);
MACD.SetLineWeight(3);

#======== lining the histogram =========
plot MACD2 = newMACD;
MACD2.SetPaintingStrategy(PaintingStrategy.line);
MACD2.SetLineWeight(2);
MACD2.SetDefaultColor(Color.WHITE);

#=======================================
Stoch.SetPaintingStrategy(PaintingStrategy.Line);
Stoch.AssignValueColor(if Stoch >= 50 and Stoch > Stoch[1] then Color.CYAN else if Stoch >= 50 and Stoch < Stoch[1] then Color.BLUE
else if Stoch <= 50 and Stoch < Stoch[1]
then Color.LIGHT_RED else Color.YELLOW);
Stoch.SetLineWeight(2);

 MACD Code
def cond1 =  if close > open and close > close[1] and MACD > MACD[1]  and Stoch > Stoch[1] then yes else Double.NaN;

plot zeroLineSqueeze = if Squeeze then 0 else Double.NaN;
zeroLineSqueeze.SetPaintingStrategy(PaintingStrategy.Points);
zeroLineSqueeze.SetLineWeight(2);
zeroLineSqueeze.SetDefaultColor(Color.BLUE);

plot zeroLineCond2 = if Cond1 then 0 else Double.NaN;
zeroLineCond2.SetPaintingStrategy(PaintingStrategy.Points);
zeroLineCond2.SetLineWeight(2);
zeroLineCond2.SetDefaultColor(Color.DarK_Green);

plot zeroLine = if IsNaN(close)
then Double.NaN
else if isNaN(Squeeze) and isNaN(Cond1)
then 0
else Double.NaN;
zeroLine.SetPaintingStrategy(PaintingStrategy.Points);
zeroLine.SetLineWeight(2);
zeroLine.SetDefaultColor(Color.Yellow);

AddLabel(1,"MACD is Histogram",Color.PINK);
AddLabel(1, "Stochastic is the line plot", color.PINK);
AddLabel(1,if squeeze then "A Squeeze is ON now" else "A squeeze is OFF now",color.PINK);

#======= Draw a line at 100 when a squeeze exists ===========
Plot D_squeeze = If squeeze then 100 else Double.NaN;
D_squeeze.SetDefaultColor(Color.MAGENTA);

#======Push label upper so squeeze line is visable ========
Plot Label_pushUP = 120;
Label_pushUP.SetDefaultColor(Color.BLUE);#insert your background color so line is invisible
C-SIMPLE EXAMPLE TO ILLUSTRATE COUNTING
#hint:<b> Counts the number of bars where close  > open. </b>\n Yes/No options are for label, count numbers, bar numbers and a count-plot.

input ShowBarNumb = No;#hint ShowBarNumb: Yes shows the bar numbers below the low.
input ShowCountNos = yes;#hint ShowCountNos:Yes shows the count of when close > open. It shows above the high.
input ShowLabel = yes;#hint ShowLabel:Yes shows a summary label of the percent of bars that are up.
input Show_Plot = No;#hint Show_Plot:Yes plots the count of up-bars. Chart-settings/general/'fit studies' must be checked to see this plot.

Def counter_AnyDay = CompoundValue (1,if close > open then counter_AnyDay[1] + 1 else counter_AnyDay[1],if close > open then 1 else 0);#Note that the value of the first bar is determined by the last CompoundValue If-condition

plot count = if close > open  &&  ShowCountNos  then counter_AnyDay else double.nan;
Count.SetPaintingStrategy(PaintingStrategy.VALUES_ABOVE);

Plot P_ShowPlot = If Show_Plot then counter_AnyDay else double.nan;

#=== below 2 lines convert to a line plot ###
#Count.SetPaintingStrategy(PaintingStrategy.line);
#Count.SetStyle(Curve.firm);

def BarNum = Barnumber();
plot Bar_Nos = if ShowBarNumb then BarNum else Double.NaN;
Bar_Nos.SetPaintingStrategy(PaintingStrategy.VALUES_BELOW);

Addlabel(ShowLabel, counter_AnyDay + " bars (" + (AsPercent(round(counter_AnyDay / barnumber(),2))) + ") out of a total of " + Barnumber() + " bars have close > open",color.cyan);
C-ILLUSTRATION OF SAME RESULT WITH DIFFERENT CODING
Comment: Some TOS studies deal with the same subject. The below code illustrates, using the DMI and DMI_Oscillator studies as examples, how you may accomplish the same result in different ways.

#====== DMI+ crossing above DMI- ============
def DMIplus  = DMI(length = 25)."DI+";#Defines the DMI+ by reference-with-parameters
def DMIminus = DMI(length = 25)."DI-";#Defines the DMI- by reference-with-parameters

#========== The below 3 code lines produce the same result ===========
def DMItest = DMIplus > DMIminus and DMIplus[1] <= DMIminus[1]; # DMItest == 1 when true; 0 when false
def crossing = Crossing(DMIplus, DMIminus, CrossingDirection.above); # crossing == 1 when true; 0 when false
def crossing = Crossing(DMI_Oscillator("length" = 25 ).Hist, DMI_Oscillator().ZeroLine,crossingDirection.above); #crossing == 1 when true; 0 when false. DMI_Oscillator is by reference-with-parameters

#===== DMI+ is above DMI- ============
def DMIplus  = DMI(length = 25)."DI+";#Defines the DMI+ by reference-with-parameters
def DMIminus = DMI(length = 25)."DI-";#Defines the DMI- by reference-with-parameters

#========== The below 2 code lines produce the same result ===========
def DMItest = DMIplus > DMIminus;# DMItest == 1 when true; 0 when false
def DMItest = DMI_Oscillator("length" = 25 ).Hist > 0;  # DMItest == 1 when true; 0 when false. DMI_Oscillator is by reference-with-parameters.

#====== DMI+ crossing below DMI- ============
def DMIplus  = DMI(length = 25)."DI+";#Defines the DMI+ by reference-with-parameters
def DMIminus = DMI(length = 25)."DI-";#Defines the DMI- by reference-with-parameters

#========== The below 3 code lines produce the same result ===========
def DMItest = DMIplus < DMIminus and DMIplus[1] >= DMIminus[1]; # DMItest == 1 when true; 0 when false
def crossing = Crossing(DMIplus, DMIminus, CrossingDirection.below); # crossing == 1 when true; 0 when false
def crossing = Crossing(DMI_Oscillator("length" = 25 ).Hist,DMI_Oscillator().ZeroLine,crossingDirection.below); #crossing == 1 when true; 0 when false. DMI_Oscillator is by reference-with-parameters.

#======= DMI+ is below the DMI- ===========
def DMIplus  = DMI(length = 25)."DI+";
def DMIminus = DMI(length = 25)."DI-";

#========== The below 2 code lines produce the same result ===========
plot DMItest = DMIplus < DMIminus; # DMItest == 1 when true; 0 when false
def DMItest = DMI_Oscillator("length" = 25).Hist > 0;  # DMItest == 1 when true; 0 when false. DMI_Oscillator is by reference-with-parameters.

#======= Any Crossing direction =========
def crossing = Crossing(DMIplus, DMIminus, CrossingDirection.any); # for any crossing == 1 when true; 0 when false
def crossing = Crossing(DMI_Oscillator("length" = 25 ).Hist,DMI_Oscillator().ZeroLine,crossingDirection.any); # for any crossing == 1 when true; 0 when false. DMI_Oscillator is by reference-with-parameters.
C&S-FLEXIBLE 200-DAY MOVING AVERAGE PLOT AND SCAN
Comment: The 200-day and 50-day are popular moving averages used to determine bullish or bearish movement. This study presents the 200 day moving average plot and a scan for within 10% of the MA(200). Any moving average may be had by use of the flexible input selections
input price = FundamentalType.CLOSE;
input aggregationPeriod = AggregationPeriod.DAY;
input length = 200;
input averageType = AverageType.SIMPLE;

#======= use below if aggregation is used ==========
#plot MovAvg = MovingAverage(averageType, Fundamental(price, period = aggregationPeriod), length);
#================================================
#======= use below if aggregation is NOT included (typical for TOS' scans) ==========
plot MovAvg = MovingAverage(averageType, Fundamental(price), length); # This is the format for scans because TOS' scans determine aggregation via a drop-down selection in lieu of the agg being within the code.

#=================================================
#============= Scan code ===================
Plot scan_above =  MovingAverage(averageType, Fundamental(price), length)  * 1.1;
Plot scan_below =  MovingAverage(averageType, Fundamental(price), length)  * 0.9;
#============= below for combined scan ====================
Plot Scan_combined = MovingAverage(averageType, Fundamental(price), length)  * 1.1 OR MovingAverage(averageType, Fundamental(price), length)  * 0.9;
C-HOW TO USE A STUDY-WITHIN-A-STUDY
Comment: There are times when one wants to use a study-within-a-study, The LinearRegressionCurve and ProjectionBands are builtins used here to plot the linear regression of the upper projection band. All four below produce the same result and also illustrate the ways to use references.
#==== LR of Upper Projection Band =======
def UPB = ProjectionBands(14).MaxBound;
def LR_UPB = LinearRegCurve(Length = 10, Price = UPB);
plot data1 = LR_UPB;

#==== Alternate that works ==========
def UPB = ProjectionBands(14).MaxBound;
def LR_UPB = LinearRegCurve(0, 10, UPB);
plot data1 = LR_UPB;

#==== Alternate that works ==========
Def UPB = ProjectionBands(14).MaxBound;
def LR_UPB = Inertia(UPB, 10);
Plot data1 = LR_UPB;

#==== Alternate that works ==========
def LR_UPB = LinearRegCurve(Length = 10, Price =  ProjectionBands(14).MaxBound);
plot data1 = LR_UPB;
C-AN ALTERED 'PERCENTCHG' TO MAKE IT MORE USEFUL
Comment: The builtin 'PercentChg' has been altered to allow inputs for loAlert and hiAlert to be less than one. This then enables this study to be referenced/used in intra-day studies/strategies where less-than-one-percent changes are normal. Info hints were also added to be more informative,
#PercentChg_SFL
#hint:Plots the percent change from length-bars ago. Input loAlert and hiAlert values may be changed to convert the plot to an oscillator which may be used as a reference in a strategy. The plot coloring automatically changes to be RED above hiAlert and CYAN below loAlert.

declare lower;

input hiAlert = 0.25;#hint hiAlert:The value, above which the plot is colored RED.\n The neutral area (between hiAlert and loAlert) is colored "Normal" = LIGHT_GRAY = 3
input length = 14;#hint length: The look-back bars being compared to.
input loAlert = 0.25;#hint loAlert:The value, below which the plot is colored GREEN. \nThe neutral area (between hiAlert and loAlert) is colored "Normal" = LIGHT_GRAY = 3
input price = close;#hint price:Select the data type to be evaluated

assert(length > 0, "'length' must be positive: " + length);

plot PercentChg = 100 * (price / price[length] - 1);
plot pHiAlert = hiAlert;
plot pLoAlert = loAlert;
PercentChg.DefineColor("HiAlert", GetColor(5));
PercentChg.DefineColor("Normal", GetColor(3));
PercentChg.DefineColor("LoAlert", GetColor(1));
PercentChg.AssignValueColor(if PercentChg > hiAlert then PercentChg.color("HiAlert") else if PercentChg < loAlert then
PercentChg.color("LoAlert") else PercentChg.color("Normal"));
pHiAlert.SetDefaultColor(GetColor(8));
pLoAlert.SetDefaultColor(GetColor(8));
C-LINEAR REGRESSION OF THE PROJECTIONBANDS STUDY
Comment: If you are learning TS, this is a good example of a study-of-a-study i.e. linear regression of the ProjectionBands study.
#LinRegr_of_ProjectionBands
#hint:<b>LinRegr_of_ProjectionBands</b>\nThis study plots the linear regression of the ProjectionBands study. Arrows are plotted at the min and max values to indicate possible long and short opportunities\nTick (133) charts present better views.\n The bands are based on LR so this study is a LR of a LR.

Input PB_length = 14;#hint PB_length:Length of the ProjectionBands. Larger values spread the bands further apart.
input LR_length = 10;#hint LR_length:The Linear Regression length. The shorter the length, the more volatile the chart. A good default is 10.

def UPB = ProjectionBands(PB_length).MaxBound;
#def LR_UPB = Inertia(UPB, 10);
def LR_UPB = LinearRegCurve(0, LR_length, UPB);

plot data1 = LR_UPB;
def Min_LR_UPB = if data1 < data1[1] && data1 < data1 [-1] then 1 else 0;

plot D_Min_LR = if Min_LR_UPB == 1 then LR_UPB else double.nan;
D_Min_LR.SetPaintingStrategy(PaintingStrategy.ARROW_UP);
D_Min_LR.SetLineWeight(3);
D_Min_LR.SetDefaultColor(Color.UPTICK);

def Max_LR_UPB = if data1 > data1[1] && data1 > data1 [-1] then 1 else 0;plot D_Max_LR = if Max_LR_UPB == 1 then
LR_UPB else double.nan;

D_Max_LR.SetPaintingStrategy(PaintingStrategy.ARROW_DOWN);
D_Max_LR.SetLineWeight(3);
D_Max_LR.SetDefaultColor(Color.DOWNTICK);
C-CLARIFICATION OF THE FOLLOWING THREE COMPARISON STUDIES
Comment:The three following comparison studies herein that are different as clarified below:
-
"COMPARISON OF ALL SECTORS OF THE S&P 500 (SPX)" plots all sectors of the S&P 500 (SPX) as absolute percent change all starting at 0 percent.
-
"S&P 500 SECTORS RELATIVE TO SPX = 0" plots all sectors of the S&P 500 (SPX) as relative percent referenced to the SPX being the 'Zero Line'. So the percentages shown are a sector’s percent above or below the SPX value.
-
"MULTIPLE INSTRUMENTS COMPARISON" is a flexible study of ANY 10 INPUT SYMBOLS any of which can be turned of (i.e. not plotted).
Each of the three above have the format of starting the comparison at 'Zero Percent'. A useful external-to-TOS tool for comparison of symbols may be had at Symbol Comparison Tool Also a S&P 500 sector comparison tool may be had at S&P 500 Sector Comparison
C-COMPARISON OF ALL SECTORS OF THE S&P 500 (SPX)
#% increase of all S&P 500 sectors
#Hint:<b> Plots the %-change-of-the S&P 500's nine sectors.</b><li>To highlight a sector of interest, change its weight in 'Edit Studies' and/or define a 'CloudSymbol' to show its SPX/Symbol cloud.</li><li>The SPX plot is highlighted.</li> <li> The color of the plots match the color of the labels and bubbles.</li><li> Labels and Bubbles may be toggled on/off. </li><li><b>'Chart Settings/Time Axis/Expansion Area' is set to '40 bars to the right'</b> to provide bubble space. </li><li>This plots on many aggs down to minutes but 'Day' agg time chart is the most meaningful. <li> Changing of the input symbols is <b>not recommended</b> but, if done, the symbol will be plotted but its ID characteristics will be wrong. For example, if  QQQ was inputted where XLY was shown, QQQ will be plotted but it will incorrectly be labeled a 'cyclicals' and QQQ will not appear in the cloud selection list. <li>You can enhance chart reading by expanding the vertical height or plotting alone.</li>

#Revised 3/17/14
declare lower;

#======= List all of the S&P 500 sectors =========
input price = FundamentalType.CLOSE;
input symbol1 = "SPX";#hint symbol1:Normally this is the SPX.
input symbol2 = "XLY";#hint symbol2:Normally this is the SPX's XLY
input symbol3 = "XLK";#hint symbol3:Normally this is the SPX's XLK
input symbol4 = "XLI";#hint symbol4:Normally this is the SPX's XLI
input symbol5 = "XLB";#hint symbol5:Normally this is the SPX's XLB
input symbol6 = "XLE";#hint symbol6:Normally this is the SPX's XLE
input symbol7 = "XLP";#hint symbol7:Normally this is the SPX's XLP
input symbol8 = "XLV";#hint symbol8:Normally this is the SPX's XLV
input symbol9 = "XLU";#hint symbol9:Normally this is the SPX's XLU
input symbol10 = "XLF";#hint symbol10:Normally this is the SPX's XLF
Input CloudSymbol = {default SPX, XLY, XLK, XLI, XLB, XLE, XLP, XLV, XLU, XLF};#hint CloudSymbol:Select the sector to show the SPX/Sector cloud. If no cloud is desired, select SPX.

#===== Define first bar values ============
def close1 = First(close(symbol1));
#AddLabel(1, "close1 = first(close(SPY)) = " + close1, Color.PINK);#For debugging
def close2 = First(close(symbol2 ));
def close3 = First(close(symbol3 ));
def close4 = First(close(symbol4 ));
def close5 = First(close(symbol5 ));
def close6 = First(close(symbol6 ));
def close7 = First(close(symbol7 ));
def close8 = First(close(symbol8 ));
def close9 = First(close(symbol9 ));
def close10 = First(close(symbol10 ));

#====== calc percents and plot related to the first bar for each sector ==========
def  d_close1 = close(symbol1);

plot D1_SPX = (d_close1 - close1) / close1 * 100;
D1_SPX.SetLineWeight(3);
def  d_close2 = close(symbol2);

plot D2_XLY = (d_close2 - close2) / close2 * 100;
def Line_wt2 = If CloudSymbol == CloudSymbol.XLY then 3 else 1;
D2_XLY.SetLineWeight(Line_wt2);
def  d_close3 = close(symbol3);

plot D3_XLK = (d_close3 - close3) / close3 * 100;
def Line_wt3 = If CloudSymbol == CloudSymbol.XLK then 3 else 1;
D3_XLK.SetLineWeight(Line_wt3);
def  d_close4 = close(symbol4);

plot D4_XLI = (d_close4 - close4) / close4 * 100;
def Line_wt4 = If CloudSymbol == CloudSymbol.XLI then 3 else 1;
D4_XLI.SetLineWeight(Line_wt4);
def  d_close5 = close(symbol5);

plot D5_XLB = (d_close5 - close5) / close5 * 100;
def Line_wt5 = If CloudSymbol == CloudSymbol.XLB then 3 else 1;
D5_XLB.SetLineWeight(Line_wt5);
def  d_close6 = close(symbol6);

plot D6_XLE = (d_close6 - close6) / close6 * 100;
def Line_wt6 = If CloudSymbol == CloudSymbol.XLE then 3 else 1;
D6_XLE.SetLineWeight(Line_wt6);
def  d_close7 = close(symbol7);

plot D7_XLP = (d_close7 - close7) / close7 * 100;
def Line_wt7 = If CloudSymbol == CloudSymbol.XLP then 3 else 1;
D7_XLP.SetLineWeight(Line_wt7);
def  d_close8 = close(symbol8);

plot D8_XLV = (d_close8 - close8) / close8 * 100;
def Line_wt8 = If CloudSymbol == CloudSymbol.XLV then 3 else 1;
D8_XLV.SetLineWeight(Line_wt8);
def  d_close9 = close(symbol9);

plot D9_XLU = (d_close9 - close9) / close9 * 100;
def Line_wt9 = If CloudSymbol == CloudSymbol.XLU then 3 else 1;
D9_XLU.SetLineWeight(Line_wt9);
def  d_close10 = close(symbol10);

plot D10_XLF = (d_close10 - close10) / close10 * 100;
def Line_wt10 = If CloudSymbol == CloudSymbol.XLF then 3 else 1;
D10_XLF.SetLineWeight(Line_wt10);

Plot Zero = 0;
Zero.SetPaintingStrategy(PaintingStrategy.LINE_VS_POINTS);
Zero.SetLineWeight(1);
Zero.SetDefaultColor(Color.YELLOW);

#===== labels defining sectors ======
input showLabel = Yes;
addLabel(showLabel, symbol1  + " = S&P 500 SECTORS >>>>>", D1_SPX .TakeValueColor());
addLabel(showLabel, symbol2 + ", cyclicals", D2_XLY.TakeValueColor());
addLabel(showLabel, symbol3 + ", technology", D3_XLK.TakeValueColor());
addLabel(showLabel, symbol4 + ", industrials", D4_XLI.TakeValueColor());
addLabel(showLabel, symbol5 + ",materials" , D5_XLB .TakeValueColor());
addLabel(showLabel, symbol6 + ", energy", D6_XLE.TakeValueColor());
addLabel(showLabel, symbol7 + ",consumer staples" , D7_XLP.TakeValueColor());
addLabel(showLabel, symbol8 + ", health care", D8_XLV.TakeValueColor());
addLabel(showLabel, symbol9 + ", utilities", D9_XLU.TakeValueColor());
addLabel(showLabel, symbol10 + ", Financials", D10_XLF.TakeValueColor());
addLabel(showLabel, "....... = zero line. This plot is the ' % change since chart's beginning'", color.YELLOW);

#====== label to define cloud =======
def Want_Cloud = If CloudSymbol == CloudSymbol.SPX then 1 else 0;
AddLabel(!Want_Cloud, "The cloud is between SPX and " + CloudSymbol,  If (CloudSymbol == CloudSymbol.XLY) then
D2_XLY.TakeValueColor() else if
(CloudSymbol == CloudSymbol.XLK) then D3_XLK.TakeValueColor() else if
(CloudSymbol == CloudSymbol.XLI) then D4_XLI.TakeValueColor() else if
(CloudSymbol == CloudSymbol.XLB) then D5_XLB.TakeValueColor() else if
(CloudSymbol == CloudSymbol.XLE) then D6_XLE.TakeValueColor() else if
(CloudSymbol == CloudSymbol.XLP) then D7_XLP.TakeValueColor() else if
(CloudSymbol == CloudSymbol.XLV) then D8_XLV.TakeValueColor() else if
(CloudSymbol == CloudSymbol.XLU) then D9_XLU.TakeValueColor() else if
(CloudSymbol == CloudSymbol.XLF) then D10_XLF.TakeValueColor() else
color.pink);

#====== Cloud based on sector selected =======
addcloud(D1_SPX , If CloudSymbol == CloudSymbol.XLY then D2_XLY else if
CloudSymbol == CloudSymbol.XLK then D3_XLK else if
CloudSymbol == CloudSymbol.XLI then D4_XLI else if
CloudSymbol == CloudSymbol.XLB then D5_XLB else if
CloudSymbol == CloudSymbol.XLE then D6_XLE else if
CloudSymbol == CloudSymbol.XLP then D7_XLP else if
CloudSymbol == CloudSymbol.XLV then D8_XLV else if
CloudSymbol == CloudSymbol.XLU then D9_XLU else if
CloudSymbol == CloudSymbol.XLF then D10_XLF else
D1_SPX, color.RED, color.GREEN);

#==== for debugging ==========
#Plot ZeroLine = 0;
#AddLabel(1, symbol1 + " first close = First(d_close) = " + First(d_close1), Color.PINK);
#AddLabel(1, symbol1 + " first close = close1 = " + close1, Color.PINK);
#AddLabel(1, "Plot Data_ Pct = " + Data_Pct1, Color.PINK);

#========== Add bubbles ============
input ShowBubbles = yes;
def BubbleLocation =  !IsNaN(close) and IsNaN(close [-1] ) && HighestAll(BarNumber())  ;
addchartbubble(BubbleLocation , D1_SPX, symbol1 , D1_SPX.TakeValueColor());
addchartbubble(BubbleLocation  && ShowBubbles, D2_XLY, symbol2 + " cyclicals", D2_XLY.TakeValueColor());
addchartbubble(BubbleLocation  && ShowBubbles, D3_XLK, symbol3 + " technology", D3_XLK.TakeValueColor());
addchartbubble(BubbleLocation  && ShowBubbles, D4_XLI, symbol4 + " industrials", D4_XLI.TakeValueColor());
addchartbubble(BubbleLocation  && ShowBubbles, D5_XLB , symbol5 + " materials           ", D5_XLB.TakeValueColor());
addchartbubble(BubbleLocation  && ShowBubbles, D6_XLE, symbol6 + " energy", D6_XLE.TakeValueColor());
addchartbubble(BubbleLocation  && ShowBubbles, D7_XLP, symbol7 + " consumer staples", D7_XLP.TakeValueColor());
addchartbubble(BubbleLocation  && ShowBubbles, D8_XLV, symbol8 + " health care", D8_XLV.TakeValueColor());
addchartbubble(BubbleLocation  && ShowBubbles, D9_XLU, symbol9 + " utilities", D9_XLU.TakeValueColor());
addchartbubble(BubbleLocation  && ShowBubbles, D10_XLF, symbol10 + " financials", D10_XLF.TakeValueColor());
C- S&P 500 SECTORS RELATIVE TO SPX = 0
#S&P 500 sectors Relative to SPX
#Hint:<b> Plots the %-change-of-the S&P 500's nine sectors.</b><li>To highlight a sector of interest, change its weight in 'Edit Studies' and/or define a 'CloudSymbol' to show its cloud referenced to zero.</li><li> The color of the plots match the color of the labels and bubbles.</li><li> Labels and Bubbles may be toggled on/off. </li><li><b>'Chart Settings/Time Axis/Expansion Area' is set to '40 bars to the right'</b> to provide bubble space. </li><li>This plots many aggs down to minutes but 'Day' agg time chart is most meaningful. <li> Changing of the input symbols is <b>not recommended</b> but, if done, the symbol will be plotted but its ID characteristics will be wrong. For example, if  QQQ was inputted where XLY was shown, QQQ will be plotted but it will incorrectly be labeled a 'cyclicals' and QQQ will not appear in the cloud selection list.</li> <li>You can enhance chart reading by expanding the vertical height or plotting alone.</li>

#Revised 3/17/14

declare lower;

#======= List all of the S&P 500 sectors =========
input price = FundamentalType.CLOSE;
input symbol1 = "SPX";#hint symbol1:Normally this is the SPX.
input symbol2 = "XLY";#hint symbol2:Normally this is the SPX's XLY
input symbol3 = "XLK";#hint symbol3:Normally this is the SPX's XLK
input symbol4 = "XLI";#hint symbol4:Normally this is the SPX's XLI
input symbol5 = "XLB";#hint symbol5:Normally this is the SPX's XLB
input symbol6 = "XLE";#hint symbol6:Normally this is the SPX's XLE
input symbol7 = "XLP";#hint symbol7:Normally this is the SPX's XLP
input symbol8 = "XLV";#hint symbol8:Normally this is the SPX's XLV
input symbol9 = "XLU";#hint symbol9:Normally this is the SPX's XLU
input symbol10 = "XLF";#hint symbol10:Normally this is the SPX's XLF
input CloudSymbol = {default SPX, XLY, XLK, XLI, XLB, XLE, XLP, XLV, XLU, XLF};#hint CloudSymbol:Select the sector to show the Sector cloud referenced to SPX = Zero. If no cloud is desired, select SPX.

#===== Define first bar values ============
def close1 = First(close(symbol1));
#AddLabel(1, "close1 = first(close(SPY)) = " + close1, Color.PINK);#For debugging
def close2 = First(close(symbol2 ));
def close3 = First(close(symbol3 ));
def close4 = First(close(symbol4 ));
def close5 = First(close(symbol5 ));
def close6 = First(close(symbol6 ));
def close7 = First(close(symbol7 ));
def close8 = First(close(symbol8 ));
def close9 = First(close(symbol9 ));
def close10 = First(close(symbol10 ));

#====== calc percents and plot related to the first bar for each sector ==========
def  d_close1 = close(symbol1);
plot D1_SPX = (d_close1 - close1) / close1 * 100;
D1_SPX.SetLineWeight(3);

def  d_close2 = close(symbol2);
plot D2_XLY = ((d_close2 - close2) / close2 * 100) - D1_SPX ;
def Line_wt2 = if (CloudSymbol == CloudSymbol.XLY , 3, 1);
D2_XLY.SetLineWeight( Line_wt2);

#addlabel(1, "Line_wt2 = " + Line_wt2, color.pink);# For debugging
def  d_close3 = close(symbol3);
plot D3_XLK = ((d_close3 - close3) / close3 * 100) - D1_SPX ;
def Line_wt3 = if CloudSymbol == CloudSymbol.XLK then 3 else 1;
D3_XLK.SetLineWeight(Line_wt3);

def  d_close4 = close(symbol4);
plot D4_XLI = ((d_close4 - close4) / close4 * 100) - D1_SPX ;
def Line_wt4 = if CloudSymbol == CloudSymbol.XLI then 3 else 1;
D4_XLI.SetLineWeight(Line_wt4);

def  d_close5 = close(symbol5);
plot D5_XLB = ((d_close5 - close5) / close5 * 100) - D1_SPX ;
def Line_wt5 = if CloudSymbol == CloudSymbol.XLB then 3 else 1;
D5_XLB.SetLineWeight(Line_wt5);

def  d_close6 = close(symbol6);
plot D6_XLE = ((d_close6 - close6) / close6 * 100) - D1_SPX ;
def Line_wt6 = if CloudSymbol == CloudSymbol.XLE then 3 else 1;
D6_XLE.SetLineWeight(Line_wt6);

def  d_close7 = close(symbol7);
plot D7_XLP = ((d_close7 - close7) / close7 * 100) - D1_SPX ;
def Line_wt7 = if CloudSymbol == CloudSymbol.XLP then 3 else 1;
D7_XLP.SetLineWeight(Line_wt7);

def  d_close8 = close(symbol8);
plot D8_XLV = ((d_close8 - close8) / close8 * 100) - D1_SPX ;
def Line_wt8 = if CloudSymbol == CloudSymbol.XLV then 3 else 1;
D8_XLV.SetLineWeight(Line_wt8);

def  d_close9 = close(symbol9);
plot D9_XLU = ((d_close9 - close9) / close9 * 100) - D1_SPX ;
def Line_wt9 = if CloudSymbol == CloudSymbol.XLU then 3 else 1;
D9_XLU.SetLineWeight(Line_wt9);

def  d_close10 = close(symbol10);
plot D10_XLF = ((d_close10 - close10) / close10 * 100) - D1_SPX ;
def Line_wt10 = if CloudSymbol == CloudSymbol.XLF then 3 else 1;;
D10_XLF.SetLineWeight(Line_wt10);

plot D1_SPX_Zero = 0;
D1_SPX_Zero .SetPaintingStrategy(PaintingStrategy.LINE);
D1_SPX_Zero .SetLineWeight(3);
D1_SPX_Zero .SetDefaultColor(Color.YELLOW);
D1_SPX_Zero.SetStyle(Curve.LONG_DASH);

#====== add ID labels ======
input ShowLabel = Yes;#hint ShowLabel: Turns labels ON/OFF
AddLabel(showLabel, symbol1  + " = S&P 500 SECTORS >>>>>", D1_SPX .TakeValueColor());
AddLabel(showLabel, symbol2 + ", cyclicals", D2_XLY.TakeValueColor());
AddLabel(showLabel, symbol3 + ", technology", D3_XLK.TakeValueColor());
AddLabel(showLabel, symbol4 + ", industrials", D4_XLI.TakeValueColor());
AddLabel(showLabel, symbol5 + ",materials" , D5_XLB .TakeValueColor());
AddLabel(showLabel, symbol6 + ", energy", D6_XLE.TakeValueColor());
AddLabel(showLabel, symbol7 + ",consumer staples" , D7_XLP.TakeValueColor());
AddLabel(showLabel, symbol8 + ", health care", D8_XLV.TakeValueColor());
AddLabel(showLabel, symbol9 + ", utilities", D9_XLU.TakeValueColor());
AddLabel(showLabel, symbol10 + ", Financials", D10_XLF.TakeValueColor());
AddLabel(showLabel, "-- -- -- = SPX zero line. Sector plots are referencec to this SPX value", Color.YELLOW);

#====== Cloud label =======
def Want_Cloud = if CloudSymbol == CloudSymbol.SPX then 1 else 0;
AddLabel(!Want_Cloud, "The cloud is between Zero and " + CloudSymbol,  if (CloudSymbol == CloudSymbol.XLY) then
  D2_XLY.TakeValueColor() else if
  (CloudSymbol == CloudSymbol.XLK) then D3_XLK.TakeValueColor() else if
  (CloudSymbol == CloudSymbol.XLI) then D4_XLI.TakeValueColor() else if
  (CloudSymbol == CloudSymbol.XLB) then D5_XLB.TakeValueColor() else if
  (CloudSymbol == CloudSymbol.XLE) then D6_XLE.TakeValueColor() else if
  (CloudSymbol == CloudSymbol.XLP) then D7_XLP.TakeValueColor() else if
  (CloudSymbol == CloudSymbol.XLV) then D8_XLV.TakeValueColor() else if
  (CloudSymbol == CloudSymbol.XLU) then D9_XLU.TakeValueColor() else if
  (CloudSymbol == CloudSymbol.XLF) then D10_XLF.TakeValueColor() else
  Color.PINK);

AddCloud(D1_SPX_Zero, if CloudSymbol == CloudSymbol.XLY then D2_XLY else if
  CloudSymbol == CloudSymbol.XLK then D3_XLK else if
  CloudSymbol == CloudSymbol.XLI then D4_XLI else if
  CloudSymbol == CloudSymbol.XLB then D5_XLB else if
  CloudSymbol == CloudSymbol.XLE then D6_XLE else if
  CloudSymbol == CloudSymbol.XLP then D7_XLP else if
  CloudSymbol == CloudSymbol.XLV then D8_XLV else if
  CloudSymbol == CloudSymbol.XLU then D9_XLU else if
  CloudSymbol == CloudSymbol.XLF then D10_XLF else if
  CloudSymbol == CloudSymbol.SPX then D1_SPX_Zero else
  D1_SPX_Zero,
  Color.RED, Color.GREEN);

#==== for debugging ==========
#Plot ZeroLine = 0;
#AddLabel(1, symbol1 + " first close = First(d_close) = " + First(d_close1), Color.PINK);
#AddLabel(1, symbol1 + " first close = close1 = " + close1, Color.PINK);
#AddLabel(1, "Plot Data_ Pct = " + Data_Pct1, Color.PINK);

#========== Add bubbles ============
input ShowBubbles = yes;#hint ShowBubbles: Turns bubbles ON/OFF
def BubbleLocation =  !IsNaN(close) and IsNaN(close [-1] ) && HighestAll(BarNumber())  ;

AddChartBubble(BubbleLocation , D1_SPX, symbol1 + "  by itself", D1_SPX.TakeValueColor());
AddChartBubble(BubbleLocation  && ShowBubbles, D2_XLY, symbol2 + " cyclicals", D2_XLY.TakeValueColor());
AddChartBubble(BubbleLocation  && ShowBubbles, D3_XLK, symbol3 + " technology", D3_XLK.TakeValueColor());
AddChartBubble(BubbleLocation  && ShowBubbles, D4_XLI, symbol4 + " industrials", D4_XLI.TakeValueColor());
AddChartBubble(BubbleLocation  && ShowBubbles, D5_XLB , symbol5 + " materials           ", D5_XLB.TakeValueColor());
AddChartBubble(BubbleLocation  && ShowBubbles, D6_XLE, symbol6 + " energy", D6_XLE.TakeValueColor());
AddChartBubble(BubbleLocation  && ShowBubbles, D7_XLP, symbol7 + " consumer staples", D7_XLP.TakeValueColor());
AddChartBubble(BubbleLocation  && ShowBubbles, D8_XLV, symbol8 + " health care", D8_XLV.TakeValueColor());
AddChartBubble(BubbleLocation  && ShowBubbles, D9_XLU, symbol9 + " utilities", D9_XLU.TakeValueColor());
AddChartBubble(BubbleLocation  && ShowBubbles, D10_XLF, symbol10 + " financials", D10_XLF.TakeValueColor());
C-MULTIPLE INSTRUMENTS COMPARISON
#by linus on the ThinkScript Lounge
#: Multiple instruments comparison
=== Method used = NormalizedSymbols
=== linus, 2014-03-16, v0.3
# Change History:
# 2014-03-16, v0.3, linus - Added inputs use1..use10.
# 2014-03-14, v0.2, linus - Added symbol key.
# 2014-03-14, v0.1, linus - Original version.
#hint: Normalize plots for various symbols and start ploting the symbols at 0 % value.

declare lower;

#hint showKey: OFF hides the symbol key, NUM numbers the symbol text, TXT shows just the symbol text.
input showKey = {OFF, NUM, default TXT};
#hint price: Changes the fundamental price type.
input price = FundamentalType.CLOSE;
#The following symbols may be changed to your preference but none should be blank. You may turn off any of these via the 'input use? = ' function. Each symbol is implied-numbered from 1 to 10, top-to-bottom sequentially.
input symbol1 = "SPY";
input symbol2 = "QQQ";
input symbol3 = "IWM";
input symbol4 = "DIA";
input symbol5 = "AAPL";
input symbol6 = "FCX";
input symbol7 = "GOOG";
input symbol8 = "IBM";
input symbol9 = "JPM";
input symbol10 = "XOM";

#hint use1: use1 to use10 toggle display of their respective symbol.
input use1 = Yes;
input use2 = Yes;
input use3 = Yes;
input use4 = Yes;
input use5 = Yes;
input use6 = Yes;
input use7 = Yes;
input use8 = Yes;
input use9 = Yes;
input use10 = Yes;
#changing the Min and Max values will determine the minimum and maximum plotted values for all symbols.

script normalize {
  input data = close;
  input Min = -10000;
  input Max = 10000;

  def ha = HighestAll( data );
  def la = LowestAll( data );
  plot normalize = (((Max-Min) * (data-la)) / (ha-la)) + Min;
}

def s1 = if use1 then Fundamental(price, symbol1) else Double.NaN;
def s2 = if use2 then Fundamental(price, symbol2) else Double.NaN;
def s3 = if use3 then Fundamental(price, symbol3) else Double.NaN;
def s4 = if use4 then Fundamental(price, symbol4) else Double.NaN;
def s5 = if use5 then Fundamental(price, symbol5) else Double.NaN;
def s6 = if use6 then Fundamental(price, symbol6) else Double.NaN;
def s7 = if use7 then Fundamental(price, symbol7) else Double.NaN;
def s8 = if use8 then Fundamental(price, symbol8) else Double.NaN;
def s9 = if use9 then Fundamental(price, symbol9) else Double.NaN;
def s10 = if use10 then Fundamental(price, symbol10) else Double.NaN;

def r1 = compoundValue(1, if !isNaN(s1) then normalize(s1) else r1[1], Double.NaN);
def r2 = compoundValue(1, if !isNaN(s2) then normalize(s2) else r2[1], Double.NaN);
def r3 = compoundValue(1, if !isNaN(s3) then normalize(s3) else r3[1], Double.NaN);
def r4 = compoundValue(1, if !isNaN(s4) then normalize(s4) else r4[1], Double.NaN);
def r5 = compoundValue(1, if !isNaN(s5) then normalize(s5) else r5[1], Double.NaN);
def r6 = compoundValue(1, if !isNaN(s6) then normalize(s6) else r6[1], Double.NaN);
def r7 = compoundValue(1, if !isNaN(s7) then normalize(s7) else r7[1], Double.NaN);
def r8 = compoundValue(1, if !isNaN(s8) then normalize(s8) else r8[1], Double.NaN);
def r9 = compoundValue(1, if !isNaN(s9) then normalize(s9) else r9[1], Double.NaN);
def r10 = compoundValue(1, if !isNaN(s10) then normalize(s10) else r10[1], Double.NaN);

#States: 0 = Not initialized, 1 = Initialized.
def st = {default "0", "1"};
# Offsets:
def ofst1;
def ofst2;
def ofst3;
def ofst4;
def ofst5;
def ofst6;
def ofst7;
def ofst8;
def ofst9;
def ofst10;

if st[1] == st."0" {
  if (!use1 or !isNaN(r1)) and (!use2 or !isNaN(r2))
  and (!use3 or !isNaN(r3)) and (!use4 or !isNaN(r4))
  and (!use5 or !isNaN(r5)) and (!use6 or !isNaN(r6))
  and (!use7 or !isNaN(r7)) and (!use8 or !isNaN(r8))
  and (!use9 or !isNaN(r9)) and (!use10 or !isNaN(r10))
  {
    ofst1 = r1;
    ofst2 = r2;
    ofst3 = r3;
    ofst4 = r4;
    ofst5 = r5;
    ofst6 = r6;
    ofst7 = r7;
    ofst8 = r8;
    ofst9 = r9;
    ofst10 = r10;
    st = st."1";
  } else {
    # Not initialized.
    ofst1 = Double.NaN;
    ofst2 = Double.NaN;
    ofst3 = Double.NaN;
    ofst4 = Double.NaN;
    ofst5 = Double.NaN;
    ofst6 = Double.NaN;
    ofst7 = Double.NaN;
    ofst8 = Double.NaN;
    ofst9 = Double.NaN;
    ofst10 = Double.NaN;
    st = st[1];
  }
} else {
  ofst1 = ofst1[1];
  ofst2 = ofst2[1];
  ofst3 = ofst3[1];
  ofst4 = ofst4[1];
  ofst5 = ofst5[1];
  ofst6 = ofst6[1];
  ofst7 = ofst7[1];
  ofst8 = ofst8[1];
  ofst9 = ofst9[1];
  ofst10 = ofst10[1];
  st = st[1];
}

def ok = !isNaN(close) and st == st."1";
plot p1 = if ok then r1 - ofst1 else Double.NaN;
plot p2 = if ok then r2 - ofst2 else Double.NaN;
plot p3 = if ok then r3 - ofst3 else Double.NaN;
plot p4 = if ok then r4 - ofst4 else Double.NaN;
plot p5 = if ok then r5 - ofst5 else Double.NaN;
plot p6 = if ok then r6 - ofst6 else Double.NaN;
plot p7 = if ok then r7 - ofst7 else Double.NaN;
plot p8 = if ok then r8 - ofst8 else Double.NaN;
plot p9 = if ok then r9 - ofst9 else Double.NaN;
plot p10 = if ok then r10 - ofst10 else Double.NaN;

plot Zero = 0;
Zero.SetDefaultColor(Color.GRAY);

def n = showKey == showKey.NUM;

AddLabel(showKey and use1, (if n then "1. " else "") + symbol1, p1.TakeValueColor());
AddLabel(showKey and use2, (if n then "2. " else "") + symbol2, p2.TakeValueColor());
AddLabel(showKey and use3, (if n then "3. " else "") + symbol3, p3.TakeValueColor());
AddLabel(showKey and use4, (if n then "4. " else "") + symbol4, p4.TakeValueColor());
AddLabel(showKey and use5, (if n then "5. " else "") + symbol5, p5.TakeValueColor());
AddLabel(showKey and use6, (if n then "6. " else "") + symbol6, p6.TakeValueColor());
AddLabel(showKey and use7, (if n then "7. " else "") + symbol7, p7.TakeValueColor());
AddLabel(showKey and use8, (if n then "8. " else "") + symbol8, p8.TakeValueColor());
AddLabel(showKey and use9, (if n then "9. " else "") + symbol9, p9.TakeValueColor());
AddLabel(showKey and use10, (if n then "10. " else "") + symbol10, p10.TakeValueColor());
C-PERCENTAGE PRICE OSCILLATOR (PPO) WITH COMPARISON SYMBOL
#Percentage Price Oscillator (PPO): with comparitor
# Mobius
# Chat Room request 03.28.2014

declare lower;

input Sym2 = "SPY";

def c2 = close(symbol = Sym2);
def PPO = (ExpAverage(close, 12) - ExpAverage(close, 26) / ExpAverage(close, 26)) * 100;
def SignalLine = ExpAverage(PPO, 9);
def PPO2 = (ExpAverage(c2, 12) - ExpAverage(c2, 26) / ExpAverage(c2, 26)) * 100;
def SignalLine2 = ExpAverage(PPO2, 9);

plot PPOline = PPO - SignalLine;
PPOLine.SetPaintingStrategy(PaintingStrategy.Histogram);
PPOLine.SetLineWeight(4);
PPOLine.AssignValueColor(if PPOLine > 0 and
  PPOLine > PPOLine[1]
  then Color.Green
  else if PPOLine > 0 and
  PPOLine < PPOLine[1]
    then Color.Yellow
    else if PPOLine < 0 and
    PPOLine < PPOLine[1]
      then Color.Red
      else Color.Blue);

plot PPOline2 = PPO2 - SignalLine2;
plot zero = if isNan(close) then Double.NaN else 0;
zero.SetDefaultColor(Color.Gray);

AddLabel(1,"Comparison Symbol = " + Sym2,PPOline2.TakeValueColor());
C-DMI OSCILLATOR FOR AN INPUTTED SYMBOL
Comment: The DMI is a price momentum indicator that is the driving force for the ADX trend indicator. At times you want to compare the chart’s DMI with another symbol. This allows you to do that. A plot of the ADX is optionable.
#hint:<b> Plots the DMI Oscillatror</b> for an inputted symbol
#title + DMI_Oscillator_For_Symbol

declare lower;

input Sym = "";#hint Sym:The input symbol for this DMI Oscillator and/or ADX
input length = 10;#hint length:The same length used for the ADX calculation and the DMI Osc calculation
input PlotADX = yes;#hint PlotADX:YES plots the ADX line

#======== DMI_For_Symbol ==========
def  Sym_high = high(Symbol = Sym);
def  Sym_low = low(Symbol = Sym);
def  Sym_close = close(Symbol = Sym);
def hiDiff = Sym_high - Sym_high[1];
def loDiff = Sym_low[1] - Sym_low;
def plusDM = if hiDiff > loDiff and hiDiff > 0 then hiDiff else 0;
def minusDM =  if loDiff > hiDiff and loDiff > 0 then loDiff else 0;
def ATR = WildersAverage(TrueRange(Sym_high, Sym_close, Sym_low), length);
def "DI+" = 100 * WildersAverage(plusDM, length) / ATR;
def "DI-" = 100 * WildersAverage(minusDM, length) / ATR;
def DX = if ("DI+" + "DI-" > 0) then 100 * AbsValue("DI+" - "DI-") / ("DI+" + "DI-") else 0;

plot ADX = If PlotADX then  WildersAverage(DX, length) else Double.nan;
ADX.AssignValueColor(if ("DI+" > "DI-") then color.uptick else color.downtick);
ADX.SetPaintingStrategy(PaintingStrategy.LINE);
ADX.SetLineWeight(2);

 of ======== DMI_For_Symbol ==========
plot Osc = "DI+" - "DI-";
plot Hist = Osc;
plot ZeroLine = 0;

Osc.SetDefaultColor(Color.WHITE);
Osc.SetLineWeight(2);

Hist.SetPaintingStrategy(PaintingStrategy.HISTOGRAM);
Hist.SetLineWeight(3);
Hist.AssignValueColor(if ("DI+" > "DI-") then color.uptick else color.downtick);
Hist.HideTitle();

ZeroLine.SetDefaultColor(Color.GRAY);

DefineGlobalColor("Positive", Color.UPTICK);
DefineGlobalColor("Negative", Color.DOWNTICK);

Def Sym_cond = If (Sym == "", 0, 1);

AddLabel(!Sym_cond, "A Symbol must be inputted", Color.RED);
AddLabel(Sym_cond, "DMI Oscillator for " + Sym,color.WHITE);
AddLabel(Sym_cond, "Current ADX(" + length + ") value = " + Round(ADX, 1), ADX.TakeValueColor());
C-'ONEGLANCE', A 13-STUDY DASHBOARD
#OneGlance by StanL Version 1.0, 5/1/14
#Hint:The 'OneGlance' study evaluates 13 criteria in a bullish(green)/bearish(red) dashboard presentation. All study parameters and the bullish-bearish-triggers may be set via inputs.
# OVERVIEW: 'OneGlance' is by StanL 5/01/14. Emphasis has been put on clarity and flexibility: clarity via bubbles and labels; flexibility via input-setable parameters and triggers to match your trading style. The info bubbles in rdite studies often state the default values buil into TOS' studies.
# USAGE: 'OneGlance' uses up a lot of a chart's real estate and is much more readable when not squeezed; perhaps as an only lower study. One viewing option, when comparing a 'OneGlance' item to a corresponding full TOS chart, is to turn off the price data in 'chart Settings'. Depending on your vision quality and space availability, you may find a magnifier usage useful (google Magnifixer freeware).
# POINT-OF-VIEW: 'OneGlance' is oriented (parameters and triggers) towards defining the bullish aspects of the studies used. Realize that if a study is not bullish, then it is not necessarily bearish. If you are bearish oriented, i.e. looking for short-opportunities, the modifying of parameters and triggers can enhance you bearish orientation.
# FUTURE: Although 'OneGlance' already uses a lot of real estate, there is no limit to additional studies being added except for space. Also, depending on your coding skills, certain user-preferred studies may be extracted to form a more- specific abridged 'OneGlance' utilizing less chart real estate and just the studies that you are most interested in.
#INPUTS: Because of the multitude of studies, the input list in 'Edit Studies' is long but components have been titled to make them self explanatory and with info-bubbles to further identify TOS default values.

declare lower;

input showlabels = yes;#hint showlabels:Toggles labels on/off.

def c = close;
def h = high;
def l = low;
def o = open;

#Polarized Fractal Efficiency
#===========================
input PFE_length = 10;#hint PFE_length:The length used in calculating the Polarized Fractal Efficiency. TOS default is 10.
input PFE_smoothingLength = 5;#hint PFE_smoothingLength:TOS default is 5.
input PFE_trig = 50;#hint PFE_trig:The value that triggers the PFE from Bullish to bearish.

def diffpfe = c - c[PFE_length - 1];
def val = 100 * Sqrt(Sqr(diffpfe) + Sqr(PFE_length)) / Sum(Sqrt(1 + Sqr(c - c[1])), PFE_length - 1);
def PFE = ExpAverage(if diffpfe > 0 then val else -val, PFE_smoothingLength);

plot PFE_Line = 17.5;
PFE_Line.SetPaintingStrategy(PaintingStrategy.LINE_VS_SQUARES);
PFE_Line.SetLineWeight(5);
PFE_Line.AssignValueColor(if PFE > PFE_trig then Color.UPTICK else Color.DOWNTICK);
#== end ==

#MomentumPercent
#=================
input MOM_Pct_trig = 0.00;#Hint MOM_Pct_trig:The percent value that toggles the chart between green and red. Normal is 0.00 %.

input MomPctLength = 5;#Hint MomPctLength:The offset length (bars back) that the current bar is compared to calculate this Momentum Percent. TOS default is 10.

def mom_pct = MomentumPercent(length = MomPctLength)."Momentum, %" - 100;
plot MomPct_Line = 21;
MomPct_Line.SetPaintingStrategy(PaintingStrategy.LINE_VS_SQUARES);
MomPct_Line.SetLineWeight(5);
MomPct_Line.AssignValueColor(if mom_pct >= MOM_Pct_trig then Color.UPTICK else Color.DOWNTICK);

#=== end ====

#Ichimoku Study
#==============
#NOTES: One major bullish indication in this study is when the Tenkan excaads the Kijun. Their default lengths of 26 and 9 may be shortened to increase response sensitivity. There are other bullish Ichimoku indicators.
input tenkan_period = 9;#hint tenkan_period:The agg-bars used to calculate the tenkan value. TOS' default is 9.
input kijun_period = 26;#hint kijun_period:The agg-bars used to calculate the kijun value. TOs' default is 26.

plot Ichi_Line = 24.5;
Ichi_Line.SetPaintingStrategy(PaintingStrategy.LINE_VS_SQUARES);
Ichi_Line.SetLineWeight(5);
Ichi_Line.AssignValueColor(if Ichimoku(tenkan_period,kijun_period)."Tenkan" >
Ichimoku(tenkan_period,kijun_period)."Kijun" then Color.UPTICK else Color.DOWNTICK);
#=== end ===

#===== RSI ======
input RSI_length = 14;#hint RSI_length:The number of bars used in the calculation. TOS' default value is 14. Shorten for a faster response.
input RSI_OB = 70;#hint RSI_OB:The RSI overbought value. TOS' default is 70.
input RSI_OS = 30;#hint RSI_OS:The RSI oversold value. TOS' default = 30.
#input price = close;
input RSILowTrig = 50;#hint RSILowTrig:The trigger is between this 'RSILowTrig' value and 100 and is rising for the last 'rsi_UpBars' bars.
input rsi_UpBars = 3;#hint rsi_UpBars: The number of consecutive rising bars used to evaluated the trigger. Note that using 0 can expose you to a RSI that is falling down from the OverBought line.

def rsi_here = RSIWilder(RSI_length, RSI_OB, RSI_OS, c)."RSI";
def RSI_trig = if (Between(rsi_here, RSILowTrig, 100) && Sum(rsi_here < rsi_here[1], rsi_UpBars) == rsi_UpBars) then 1 else 0;
#def HullMA = HullMovingAvg(Price = Hull_price, length = Hull_length, displace = Hull_displace).HMA;

plot rsi_Line = 28;
rsi_Line.SetPaintingStrategy(PaintingStrategy.LINE_VS_SQUARES);
rsi_Line.SetLineWeight(5);
#def HullMA = HullMovingAvg(Price = Hull_price, length = Hull_length, displace = Hull_displace).HMA;
rsi_Line.AssignValueColor(if RSI_trig then Color.UPTICK else Color.DOWNTICK);
#== end ==

#Bollinger Bands MOBO(MOmentum BreakOut)
#============================================
#Explanation of how this works.  +/- 0.8 std deviation Bollinger Bands are the criteris for bullish/bearish plots. When the close rises above the upper band the signal is bullish and stays bullish until the ose moves below the lower band when the plot turns to bearish and remains bearish until the close rises above the upper band.
input MOBO_length = 10;#hint MOBO_length:The agg-bars used in the standard deviation(SD) calculation to define the upper and lower bands.
input Num_Dev_Dn = -0.8;#hint Num_Dev_Dn:The SD of the lower band. Similar to the 2,0 SD used in the Bollinger Bands
input Num_Dev_up =  0.8;#hint Num_Dev_up:The SD of the upper band. Similar to the 2,0 SD used in the Bollinger Bands

def sDev = StDev(data = c, length = MOBO_length);
def Midmobo = Average(c, length = MOBO_length);
def Lowermobo = Midmobo + Num_Dev_Dn * sDev;
def Uppermobo = Midmobo + Num_Dev_up * sDev;
def upmobo = if upmobo[1] == 0 and c >= Uppermobo then 1 else if upmobo[1] == 1 and c > wermobo then 1 else 0;
def upmo = if upmobo  and c > Uppermobo then 1 else 0;
def dnmo = if !upmobo and c > Lowermobo then 1 else 0;

plot MOBO_Line = 31.5;
MOBO_Line.SetPaintingStrategy(PaintingStrategy.LINE_VS_SQUARES);
MOBO_Line.SetLineWeight(5);
MOBO_Line.AssignValueColor(if upmobo == 1 then Color.UPTICK else Color.DOWNTICK);
#=== end ===

#==== Squeeze by Mobius @ My Trade =====

def nK            = 1.5;
def nBB           = 2.0;
def lengthsqueeze = 20;
def BBHalfWidth = StDev(c, lengthsqueeze);
def KCHalfWidth = nK * AvgTrueRange(h, c, l, lengthsqueeze);
def isSqueezed  =  nBB * BBHalfWidth / KCHalfWidth < 1;

plot BBS_Ind = if isSqueezed then 50 else 50;
BBS_Ind.AssignValueColor(if isSqueezed then Color.RED else Color.WHITE);
BBS_Ind.SetPaintingStrategy(PaintingStrategy.POINTS);
BBS_Ind.SetLineWeight(3);
BBS_Ind.HideBubble();
#=== end ===

#== Line Spacer ===
plot line55 = 55;#Used to manage space to set labels above this value.
line55.SetDefaultColor(Color.BLUE);#Insert color to match your background to make line invisible
#== end ==

#==== DMI_Oscillator ====
input DMIO_Length = 10;#hint DMIO_Length:The agg-bars used to calculate the DMI_Oscillator. TOS' default is 10.
input DMIO_trig = 0;#hint DMIO_trig:The trigger value that toggles bullish/bearish. Low values risk a turn down to below 0. Persistent values above 10-15 would be considered a moderate/strong bullish indication.

def DMI_OSC_here = reference DMI_Oscillator(length = DMIO_Length).Osc;

plot DMIO_Line = 14;
DMIO_Line.SetPaintingStrategy(PaintingStrategy.LINE_VS_SQUARES);
DMIO_Line.SetLineWeight(5);
DMIO_Line.AssignValueColor(if DMI_OSC_here > DMIO_trig then Color.UPTICK else Color.DOWNTICK);
#=== end ===

#==== ADX Indicator ====
input ADX_Length = 10;#hint ADX_Length: Length used in the ADX calculation of the trigger ADX. TOS' default is 14. You may want to use 10 to be consistent with the DMI_Oscillator.
input ADX_trig = 15;#hint ADX_trig:The bullish ADX value that toggles the bull/bear chart display. You may use any value of a bullish ADX to suit your preference. A strong ADX is >= 25 especially if it persists.

def ADX_here = Round(reference ADX(length = ADX_Length), 1);
def DMI_Pos = if DMI(ADX_Length)."DI+" > DMI(ADX_Length)."DI-" then 1 else 0;# DMI+ > DMI-

plot ADX_Line = 10.5;
ADX_Line.SetPaintingStrategy(PaintingStrategy.LINE_VS_SQUARES);
ADX_Line.SetLineWeight(5);
ADX_Line.AssignValueColor(if DMI_Pos && ADX_here >= ADX_trig then Color.UPTICK else Color.DOWNTICK);
#== end ==

#TrueStrengthIndex
#===================
input TSI_trig = 0 ;#hint TSI_trig:The value that toggles bull/bear. TSI has a 'TSI(value)' and a 'signal' line with a zero line. This deals with the 'TSI(value)' being above the zero line. An earlier trigger could be had by analysis as was done with the MACD herein.

def TSI_here = reference TrueStrengthIndex(25, 13, 8, "WMA").TSI;
plot TSI_Line = 7;
TSI_Line.SetPaintingStrategy(PaintingStrategy.LINE_VS_SQUARES);
TSI_Line.SetLineWeight(5);
TSI_Line.AssignValueColor(if TSI_here > TSI_trig then Color.UPTICK else Color.DOWNTICK);
#=== end ===

#Dynamic Momentum Index
#=======================
#Note: This is similar to the RSI but is more sensitive/responsive
input DYMI_length = 14;#hint DYMI_length:The length usd for this calculation. TOS default is 14.
input DYMI_trig = 70;#hint DYMI_trig:The trigger value used to toggle the Bullish/bearish indication.

def DYMI_here = DynamicMomentumIndex(DYMILength = DYMI_length).DYMI;

plot DYMI_Line = 3.5;
DYMI_Line.SetPaintingStrategy(PaintingStrategy.LINE_VS_SQUARES);
DYMI_Line.SetLineWeight(5);
DYMI_Line.AssignValueColor(if DYMI_here >= DYMI_trig then Color.UPTICK else Color.DOWNTICK);
#== end ====

#====== MACD =======
#========= Note about the two MACD  indicators below =======
# HOTES: People use the MACD for decision making in two ways. The first below is when the MACD line crosses above the signal line. This is also when the MACD histogram goes above zero. This method gives early indications.
#The second frequent use of the MACD is when the MACD itself (value) crosses aboce the zero line. This is a less risky use of the MACD but may sacrifice early entry and related profits.
#==== end of notes ========

#====== MACD.value is above MACD.avg (signal line)======
input fastLength_1 = 12;#hint fastLength_1:For the MACD plot that evaluates the MACD.Value being above the MACD.Avg (signal line).
input slowLength_1 = 26;#hint slowLength_1:For the MACD plot that evaluates the MACD.Value being above the MACD.Avg (signal line).
input MACDLength_1 = 9;#hint MACDLength_1:For the MACD plot that evaluates the MACD.Value being above the MACD.Avg (signal line).
input AverageType_1 = {SMA, default EMA};#hint AverageType_1:For the MACD plot that evaluates the MACD.Value being above the MACD.Avg (signal line).

def macd_Val_1 = MACD(fastLength_1, slowLength_1, MACDLength_1, AverageType_1).Value;
def macd_Avg1 = MACD(fastLength_1, slowLength_1, MACDLength_1, AverageType_1).Avg;
def MACD_trig = if MACD().value > MACD().avg then 1 else 0;
#def MACD_Value = MACD(MACDLength = MACDLength, AverageType = "EMA").Diff;

plot Macd_Line1 = 35;
Macd_Line1.SetPaintingStrategy(PaintingStrategy.LINE_VS_SQUARES);
Macd_Line1.SetLineWeight(5);
Macd_Line1.AssignValueColor(if macd_Val_1 > macd_Avg1 then Color.UPTICK else Color.DOWNTICK);
#== end ====

#==== MACD value is above zero ====
#NOTE that the fast and slow length may been shortened for faster response. These inputs have a '_2' after the standard MACD parameters to distinguish them from the MACD.
input fastLength_2 = 12;#hint fastLength_2:For the MACD plot that evaluates the MACD.Value being above the zero line. The value may be altered for faster response.
input slowLength_2 = 26;#hint slowLength_2:For the MACD plot that evaluates the MACD.Value being above the zero line. The value may be altered for faster response.
input MACDLength_2 = 9;#hint MACDLength_2:For the MACD plot that evaluates the MACD.Value being above the zero line. The value may be altered for faster response.
input AverageType_2 = {SMA, default EMA};#hint AverageType_2:For the MACD plot that evaluates the MACD.Value being above the zero line. The value may be altered for faster/slower response. This selects tha average type to be used. input macdVal_trig = 0;#hint macdVal_trig:For the MACD plot that evaluates the MACD value being above the zero line. The normal default value is 0, i.e. the zero line, but may be altered here.

def MACDValue_2 = MACD(fastLength_2, slowLength_2, MACDLength_2, AverageType_2).Value;

plot MACD_Line2 = 38.5;
MACD_Line2.SetPaintingStrategy(PaintingStrategy.LINE_VS_SQUARES);
MACD_Line2.SetLineWeight(5);
MACD_Line2.AssignValueColor(if MACDValue_2 >= macdVal_trig then Color.UPTICK else Color.DOWNTICK);
#== end ==

#======= HullMovingAvg ==========

input Hull_price = close;#hint Hull_price:The price basis of the HMA.
input Hull_length = 20;#hint Hull_length:The agg-bars used in the HMA calculation.
input Hull_displace = 0;#hint Hull_displace:Displacement of the HMA in agg-bars
def HullMA = HullMovingAvg(Price = Hull_price, length = Hull_length, displace = Hull_displace).HMA;

 plot Hull_Line = 42;
 Hull_Line.SetPaintingStrategy(PaintingStrategy.LINE_VS_SQUARES);
 Hull_Line.SetLineWeight(5);
 Hull_Line.AssignValueColor(if HullMA > HullMA[1] then Color.UPTICK else Color.DOWNTICK);
#== end ==

#Define variables used to place a bubble
#========================================

#Input Offset = BarNumber() / 2;
def barNum = BarNumber();
def offset = 50;
def LastBar = !IsNaN(open) and IsNaN(open [-1] ) ;
def BubbleLocation = LastBar[offset];
def FirstBar = if barNum == 1 then 1 else 0;
def FirstBarValue = if barNum == 1 then 1 else 0;
def LastBarValue = if LastBar then barNum else 0;
def MidBar = if LastBar then barNum == (BarNumber() / 2)  else 0;

#example
#addchartbubble(LastBar,45, "This is a last bar bubble", color.White);

#==========================================
#======== Bubbles ==============
AddChartBubble(FirstBar, 42, " HullMovingAvg(" + Hull_length + "). " + "Trigger = bullish when HullMovingAvg > previous HullMovingAvg.", Color.WHITE);
AddChartBubble(FirstBar, 35, " MACD(" + fastLength_1 + "," +  slowLength_1 + "," + MACDLength_1 + "," + AverageType_1 + "). Bullish when MACD.Value is above MACD.Avg (signal line). Trigger = MACD().value > MACD().avg", Color.PINK);
AddChartBubble(FirstBar, 38.5, " MACD.Value(" + fastLength_2 + "," + slowLength_2 + "," + MACDLength_2 + "," + AverageType_2 + ")" + "Bullish when MACD.Value is above the zero line. Trigger = " + macdVal_trig + "(Normally the zero line)", Color.PINK);
AddChartBubble(FirstBar, 17.5 , " Polarized Fractal Efficiency (" + PFE_length + "). " + "Trend UP = 0 to 100. Trigger = " + PFE_trig, Color.WHITE);
AddChartBubble(FirstBar, 21, " MomentumPercent(" + MomPctLength + "). Bullish when > 0 % & for long periods. Trigger = " + MOM_Pct_trig + " percent", Color.CYAN);
AddChartBubble(FirstBar, 24.5, " Ichimoku(" + tenkan_period + ", " + kijun_period + "). Bullish trigger = when tenkan > kijun. The more the diff, the stronger the trend.", Color.WHITE);
AddChartBubble(FirstBar, 28, " RSI(" + RSI_length + ")." + " Trigger = RSI is between " + RSILowTrig + " and 100 and is rising for last " + rsi_UpBars + "  bars", Color.CYAN);
AddChartBubble(FirstBar, 31.5, " Bollinger Bands(+/- " + Num_Dev_up + " SD)" + " MOmentum Break Out (MOBO(" + MOBO_length + "))." + " Trigger when close goes above upper band and stays bullish until the close goes below the lower band.", Color.WHITE);
AddChartBubble(FirstBar, 14, " DMI_Oscillator(" + DMIO_Length + "). Bullish DMI = green = >0: Bearish DMI = red. Trigger = " + DMIO_trig, Color.PINK);
AddChartBubble(FirstBar, 10.5, " ADX(" + ADX_Length + "). Bullish ADX = green: Bearish ADX = red. Strong bullish ADX trend  is > 25. Trigger = " + ADX_trig, Color.PINK);
AddChartBubble(FirstBar, 7, " TrueStrengthIndex(25,13,8,'WMA')." + " Bullish TSI = green & 0 to +50.  Bearish TSI = red & 0 to -50.  Trigger = " + TSI_trig, Color.CYAN);
AddChartBubble(FirstBar, 50, " RED dot denotes presence of a SQUEEZE", Color.WHITE);
AddChartBubble(FirstBar, 3.5, " DynamicMomentumIndex-DYMI(" + DYMI_length + "). Overbought = 70: Oversold  = 30. Trigger = " + DYMI_trig, Color.CYAN);
#== end ==

#== Labels ==
#Count of Periods in consecutive squeeze
rec count = if isSqueezed then count[1] + 1 else 0;

AddLabel(showlabels, if isSqueezed then "Squeeze is on for " +  count + " bars" else "No Squeeze is on", if isSqueezed then Color.RED else Color.WHITE);
AddLabel(showlabels, "HullMovingAvg(" + Hull_length + ") = " + Round(HullMA, 2), if HullMA > HullMA[1] then Color.GREEN else Color.RED);
AddLabel(showlabels, "MACD.Value(" + round(macd_Val_1,1) + ") cross above MACD.Avg(" + Round(macd_Avg1,1) + ") (signal) = " + if round(macd_Val_1,1) > Round(macd_Avg1,1) then "true" else "not true", if round(macd_Val_1,1) > Round(macd_Avg1,1) then Color.GREEN else color.LIGHT_RED);
AddLabel(showlabels, "MACD.Value(" + round(MACDValue_2,1) + ") cross above 0 line = " + if round(MACDValue_2,1) >= 0 then "true" else "not true", if round(MACDValue_2,1) >= 0 then color.GREEN else color.LIGHT_RED);

AddLabel(showlabels, if upmobo and  c < Uppermobo then "MOBO close is between(" + Num_Dev_up + " SD) bands"
  else if upmo then "MOBO is above upper(" + Num_Dev_up + " SD) band"
  else if dnmo then "MOBO is below lower(" + Num_Dev_up + " SD) band"
  else "", Color.GREEN);

AddLabel(showlabels, "RSI(" + RSI_length + ") = " + Round(rsi_here, 1), if RSI_trig then Color.GREEN else Color.RED);
AddLabel(showlabels, "Ichimoku(" + tenkan_period + ", " + kijun_period + "):" + "Tenkan / Kijan = " + Ichimoku().Tenkan +
" / " + Ichimoku().kijun, if Ichimoku()."Tenkan" > Ichimoku()."Kijun" then Color.GREEN else Color.RED);
AddLabel(showlabels, "MomentumPercent(" + MomPctLength + ") = " + Round(mom_pct, 2) + " %", if mom_pct >=
MOM_Pct_trig then Color.GREEN else Color.RED);

AddLabel(showlabels, "Polarized Fractal Eff(" + PFE_length + ") = " + Round(PFE, 0), if PFE >= PFE_trig then Color.GREEN else Color.RED);
AddLabel(showlabels, "DMI Osc(" + DMIO_Length + ") = " + Round(DMI_OSC_here, 1), if DMI_OSC_here >= DMIO_trig then Color.GREEN else Color.RED);
AddLabel(showlabels, "ADX(" + ADX_Length + ") = " + ADX_here, if ADX_here >= ADX_trig && DMI_Pos then Color.GREEN else Color.RED);
AddLabel(showlabels, "TSI = " + Round(TSI_here,1), if TSI_here >= TSI_Trig then color.GREEN else color.RED);
AddLabel(showlabels, "DYMI(" + DYMI_length + ") = " + Round(DYMI_here, 1), if DYMI_here >= DYMI_trig then Color.GREEN else Color.RED);
#== end ==
 of Code


#MomentumPercent

#=================
input MOM_Pct_trig = 0.00;#Hint MOM_Pct_trig:The percent value that toggles the chart between green and red. Normal is 0.00 %.
input MomPctLength = 5;#Hint MomPctLength:The offset length (bars back) that the current bar is compared to calculate this Momentum Percent. TOS default is 10.

def mom_pct = MomentumPercent(length = MomPctLength)."Momentum, %" - 100;

plot MomPct_Line = 21;
MomPct_Line.SetPaintingStrategy(PaintingStrategy.LINE_VS_SQUARES);
MomPct_Line.SetLineWeight(5);
MomPct_Line.AssignValueColor(if mom_pct >= MOM_Pct_trig then Color.UPTICK else Color.DOWNTICK);
#=== end ====

#Ichimoku Study
#==============
#NOTES: One major bullish indication in this study is when the Tenkan excaads the Kijun. Their default lengths of 26 and 9 may be shortened to increase response sensitivity. There are other bullish Ichimoku indicators. input tenkan_period = 9;#hint tenkan_period:The agg-bars used to calculate the tenkan value. TOS' default is 9.

input kijun_period = 26;#hint kijun_period:The agg-bars used to calculate the kijun value. TOs' default is 26.

plot Ichi_Line = 24.5;
Ichi_Line.SetPaintingStrategy(PaintingStrategy.LINE_VS_SQUARES);
Ichi_Line.SetLineWeight(5);
Ichi_Line.AssignValueColor(if Ichimoku(tenkan_period,kijun_period)."Tenkan" >
Ichimoku(tenkan_period,kijun_period)."Kijun" then Color.UPTICK else Color.DOWNTICK);
#=== end ===

#===== RSI ======
input RSI_length = 14;#hint RSI_length:The number of bars used in the calculation. TOS' default value is 14. Shorten for a faster response.
input RSI_OB = 70;#hint RSI_OB:The RSI overbought value. TOS' default is 70.
input RSI_OS = 30;#hint RSI_OS:The RSI oversold value. TOS' default = 30.
#input price = close;
input RSILowTrig = 50;#hint RSILowTrig:The trigger is between this 'RSILowTrig' value and 100 and is rising for the last 'rsi_UpBars' bars.
input rsi_UpBars = 3;#hint rsi_UpBars: The number of consecutive rising bars used to evaluated the trigger. Note that using 0 can expose you to a RSI that is falling down from the OverBought line.
def rsi_here = RSIWilder(RSI_length, RSI_OB, RSI_OS, c)."RSI";
def RSI_trig = if (Between(rsi_here, RSILowTrig, 100) && Sum(rsi_here < rsi_here[1], rsi_UpBars) == rsi_UpBars) then 1 else 0;
#def HullMA = HullMovingAvg(Price = Hull_price, length = Hull_length, displace = Hull_displace).HMA;

plot rsi_Line = 28;
rsi_Line.SetPaintingStrategy(PaintingStrategy.LINE_VS_SQUARES);
rsi_Line.SetLineWeight(5);
#def HullMA = HullMovingAvg(Price = Hull_price, length = Hull_length, displace = Hull_displace).HMA;
rsi_Line.AssignValueColor(if RSI_trig then Color.UPTICK else Color.DOWNTICK);
#== end ==


#Bollinger Bands MOBO(MOmentum BreakOut)
#============================================

#Explanation of how this works.  +/- 0.8 std deviation Bollinger Bands are the criteris for bullish/bearish plots. When the close rises above the upper band the signal is bullish and stays bullish until the close moves below the lower band when the plot turns to bearish and remains bearish until the close rises above the upper band.

input lengthmobo = 10;
input Num_Dev_Dn = -0.8;
input Num_Dev_up =  0.8;

def sDev = StDev(data = c, length = lengthmobo);
def Midmobo = Average(c, length = lengthmobo);
def Lowermobo = Midmobo + Num_Dev_Dn * sDev;
def Uppermobo = Midmobo + Num_Dev_up * sDev;
def upmobo = if upmobo[1] == 0 and c >= Uppermobo then 1 else if upmobo[1] == 1 and c > Lowermobo then 1 else 0;
def upmo = if upmobo  and c > Uppermobo then 1 else 0;
def dnmo = if !upmobo and c > Lowermobo then 1 else 0;

plot MOBO_Line = 31.5;
MOBO_Line.SetPaintingStrategy(PaintingStrategy.LINE_VS_SQUARES);
MOBO_Line.SetLineWeight(5);
MOBO_Line.AssignValueColor(if upmobo == 1 then Color.UPTICK else Color.DOWNTICK);

- #=== end ===

- #==== Squeeze by Mobius @ My Trade =====

def nK            = 1.5;
def nBB           = 2.0;
def lengthsqueeze = 20;
def BBHalfWidth = StDev(c, lengthsqueeze);
def KCHalfWidth = nK * AvgTrueRange(h, c, l, lengthsqueeze);
def isSqueezed  =  nBB * BBHalfWidth / KCHalfWidth < 1;

plot BBS_Ind = if isSqueezed then 50 else 50;
BBS_Ind.AssignValueColor(if isSqueezed then Color.RED else Color.WHITE);
BBS_Ind.SetPaintingStrategy(PaintingStrategy.POINTS);
BBS_Ind.SetLineWeight(3);
BBS_Ind.HideBubble();
#=== end ===

#== Line Spacer ===
plot line55 = 55;#Used to manage space to set labels above this value.
line55.SetDefaultColor(Color.BLUE);#Insert color to match your background to make line invisible
#== end ==

#==== DMI_Oscillator ====
input DMIO_Length = 10;#hint DMIO_Length:The agg-bars used to calculate the DMI_Oscillator. TOS' default is 10.
input DMIO_trig = 0;# hint DMI_trig:The trigger value that toggles bullish/bearish. Low values risk a turn down to below 0. Persistent values above 10-15 would be considered a moderate/strong bullish indication.

def DMI_OSC_here = reference DMI_Oscillator(length = DMIO_Length).Osc;

plot DMIO_Line = 14;
DMIO_Line.SetPaintingStrategy(PaintingStrategy.LINE_VS_SQUARES);
DMIO_Line.SetLineWeight(5);
DMIO_Line.AssignValueColor(if DMI_OSC_here > DMIO_trig then Color.UPTICK else Color.DOWNTICK);
#=== end ===

#==== ADX Indicator ====
input ADX_Length = 10;#hint ADXLength: Length used in the ADX calculation of the trigger ADX. TOS' default is 14. You may want to use 10 to be consistent with the DMI_Oscillator.
input ADX_trig = 15;#hint ADX_trig:The bullish ADX value that toggles the bull/bear chart display. You may use any value of a bullish ADX to suit your preference. A strong ADX is >= 25 especially if it persists.

def ADX_here = Round(reference ADX(length = ADX_Length), 1);
def DMI_Pos = if DMI(ADX_Length)."DI+" > DMI(ADX_Length)."DI-" then 1 else 0;# DMI+ > DMI-

plot ADX_Line = 10.5;
ADX_Line.SetPaintingStrategy(PaintingStrategy.LINE_VS_SQUARES);
ADX_Line.SetLineWeight(5);
ADX_Line.AssignValueColor(if DMI_Pos && ADX_here >= ADX_trig then Color.UPTICK else Color.DOWNTICK);
#== end ==

#TrueStrengthIndex
#===================
input TSI_trig = 0 ;#hint TSI_trig:The value that toggles bull/bear. TSI has a 'TSI(value)' and a 'signal' line with a zero line. This deals with the 'TSI(value)' being above the zero line. An earlier trigger could be had by analysis as was done with the MACD herein.

def TSI_here = reference TrueStrengthIndex(25, 13, 8, "WMA").TSI;

plot TSI_Line = 7;
TSI_Line.SetPaintingStrategy(PaintingStrategy.LINE_VS_SQUARES);
TSI_Line.SetLineWeight(5);
TSI_Line.AssignValueColor(if TSI_here > TSI_trig then Color.UPTICK else Color.DOWNTICK);
#=== end ===

#Dynamic Momentum Index
#=======================
#Note: This is similar to the RSI but is more sensitive/responsive
input DYMI_length = 14;#hint DYMI_length:The length usd for this calculation. TOS default is 14.
input DYMI_trig = 70;

def DYMI_here = DynamicMomentumIndex(DYMILength = DYMI_length).DYMI;

plot DYMI_Line = 3.5;
DYMI_Line.SetPaintingStrategy(PaintingStrategy.LINE_VS_SQUARES);
DYMI_Line.SetLineWeight(5);
DYMI_Line.AssignValueColor(if DYMI_here >= DYMI_trig then Color.UPTICK else Color.DOWNTICK);
#== end ====

#====== MACD =======

#========= Note about the two MACD  indicators below =======
# HOTES: People use the MACD for decision making in two ways. The first below is when the MACD line crosses above the signal line. This is also when the MACD histogram goes above zero. This method gives early indications.
#The second frequent use of the MACD is when the MACD itself (value) crosses aboce the zero line. This is a less risky use of the MACD but may sacrifice early entry and related profits.
#==== end of notes ========

#====== MACD.value is above MACD.avg (signal line)======
input fastLength_1 = 12;#hint fastLength:For the MACD plot that evaluates the MACD.Value being above the MACD.Avg (signal line).
input slowLength_1 = 26;#hint slowLength:For the MACD plot that evaluates the MACD.Value being above the MACD.Avg (signal line).
input MACDLength_1 = 9;#hint MACDLength:For the MACD plot that evaluates the MACD.Value being above the MACD.Avg (signal line).
input AverageType_1 = {SMA, default EMA};#hint AverageType:For the MACD plot that evaluates the MACD.Value being above the MACD.Avg (signal line).

def macd_Val_1 = MACD(fastLength_1, slowLength_1, MACDLength_1, AverageType_1).Value;
def macd_Avg1 = MACD(fastLength_1, slowLength_1, MACDLength_1, AverageType_1).Avg;
def MACD_trig = if MACD().value > MACD().avg then 1 else 0;
#def MACD_Value = MACD(MACDLength = MACDLength, AverageType = "EMA").Diff;

plot Macd_Line1 = 35;
Macd_Line1.SetPaintingStrategy(PaintingStrategy.LINE_VS_SQUARES);
Macd_Line1.SetLineWeight(5);
Macd_Line1.AssignValueColor(if macd_Val_1 > macd_Avg1 then Color.UPTICK else Color.DOWNTICK);
#== end ====

#==== MACD value is above zero ====
#NOTE that the fast and slow length may been shortened for faster response. These inputs have a '_2' after the standard MACD parameters to distinguish them from the MACD.
input fastLength_2 = 12;#hint fastLength_2:For the MACD plot that evaluates the MACD.Value being above the zero line. The value may be altered for faster response.
input slowLength_2 = 26;#hint slowLength_2:For the MACD plot that evaluates the MACD.Value being above the zero line. The value may be altered for faster response.
input MACDLength_2 = 9;#hint MACDLength_2:For the MACD plot that evaluates the MACD.Value being above the zero line. The value may be altered for faster response.
input AverageType_2 = {SMA, default EMA};#hint AverageType_2:For the MACD plot that evaluates the MACD.Value being above the zero line. The value may be altered for faster/slower response. This selects tha average type to be used.
input macdVal_trig = 0;#hint macdVal_trig:For the MACD plot that evaluates the MACD value being above the zero line. The normal default value is 0, i.e. the zero line, but may be altered here.

def MACDValue_2 = MACD(fastLength_2, slowLength_2, MACDLength_2, AverageType_2).Value;

plot MACD_Line2 = 38.5;
MACD_Line2.SetPaintingStrategy(PaintingStrategy.LINE_VS_SQUARES);
MACD_Line2.SetLineWeight(5);
MACD_Line2.AssignValueColor(if MACDValue_2 >= macdVal_trig then Color.UPTICK else Color.DOWNTICK);
#== end ==

#======= HullMovingAvg ==========
input Hull_price = close;
input Hull_length = 20;
input Hull_displace = 0;

def HullMA = HullMovingAvg(Price = Hull_price, length = Hull_length, displace = Hull_displace).HMA;

plot Hull_Line = 42;
Hull_Line.SetPaintingStrategy(PaintingStrategy.LINE_VS_SQUARES);
Hull_Line.SetLineWeight(5);
Hull_Line.AssignValueColor(if HullMA > HullMA[1] then Color.UPTICK else Color.DOWNTICK);
#== end ==

#Define variables used to place a bubble
#========================================
#Input Offset = BarNumber() / 2;
def barNum = BarNumber();
def offset = 50;
def LastBar = !IsNaN(open) and IsNaN(open [-1] ) ;
def BubbleLocation = LastBar[offset];
def FirstBar = if barNum == 1 then 1 else 0;
def FirstBarValue = if barNum == 1 then 1 else 0;
def LastBarValue = if LastBar then barNum else 0;
def MidBar = if LastBar then barNum == (BarNumber() / 2)  else 0;
#example
#addchartbubble(LastBar,45, "This is a last bar bubble", color.White);

#==========================================
#======== Bubbles ==============
AddChartBubble(FirstBar, 42, " HullMovingAvg(" + Hull_length + "). " + "Trigger = bullish when HullMovingAvg > previous HullMovingAvg.", Color.WHITE);
AddChartBubble(FirstBar, 35, " MACD(" + fastLength_1 + "," +  slowLength_1 + "," + MACDLength_1 + "," + AverageType_1 + "). Bullish when MACD.Value is above MACD.Avg (signal line). Trigger = MACD().value > MACD().avg", Color.PINK);
AddChartBubble(FirstBar, 38.5, " MACD.Value(" + fastLength_2 + "," + slowLength_2 + "," + MACDLength_2 + "," + AverageType_2 + ")" + "Bullish when MACD.Value is above the zero line. Trigger = " + macdVal_trig + "(Normally the zero line)", Color.PINK);
AddChartBubble(FirstBar, 17.5 , " Polarized Fractal Efficiency (" + PFE_length + "). " + "Trend UP = 0 to 100. Trigger = " + PFE_trig, Color.WHITE);
AddChartBubble(FirstBar, 21, " MomentumPercent(" + MomPctLength + "). Bullish when > 0 % & for long periods. Trigger = " + MOM_Pct_trig + " percent", Color.CYAN);
AddChartBubble(FirstBar, 24.5, " Ichimoku(" + tenkan_period + ", " + kijun_period + "). Bullish trigger = when tenkan > kijun. The more the diff, the stronger the trend.", Color.WHITE);
AddChartBubble(FirstBar, 28, " RSI(" + RSI_length + ")." + " Trigger = RSI is between " + RSILowTrig + " and 100 and is rising for last " + rsi_UpBars + "  bars", Color.CYAN);
AddChartBubble(FirstBar, 31.5, " Bollinger Bands(+/- " + Num_Dev_up + " SD)" + " MOmentum Break Out (MOBO(" + lengthmobo + "))." + " Trigger when close goes above upper band and stays bullish until the close goes below the lower band.", Color.WHITE);
AddChartBubble(FirstBar, 14, " DMI_Oscillator(" + DMIO_Length + "). Bullish DMI = green = >0: Bearish DMI = red. Trigger = " + DMIO_trig, Color.PINK);
AddChartBubble(FirstBar, 10.5, " ADX(" + ADX_Length + "). Bullish ADX = green: Bearish ADX = red. Strong bullish ADX trend  is > 25. Trigger = " + ADX_trig, Color.PINK);
AddChartBubble(FirstBar, 7, " TrueStrengthIndex(25,13,8,'WMA')." + " Bullish TSI = green & 0 to +50.  Bearish TSI = red & 0 to -50.  Trigger = " + TSI_trig, Color.CYAN);
AddChartBubble(FirstBar, 50, " RED dot denotes presence of a SQUEEZE", Color.WHITE);
AddChartBubble(FirstBar, 3.5, " DynamicMomentumIndex-DYMI(" + DYMI_length + "). Overbought = 70: Oversold  = 30.
Trigger = " + DYMI_trig, Color.CYAN);
#== end ==

#== Labels ==
#Count of Periods in consecutive squeeze
rec count = if isSqueezed then count[1] + 1 else 0;

AddLabel(showlabels, if isSqueezed then "Squeeze is on for " +  count + " bars" else "No Squeeze is on", if isSqueezed then Color.RED else Color.WHITE);
AddLabel(showlabels, "HullMovingAvg(" + Hull_length + ") = " + Round(HullMA, 2), if HullMA > HullMA[1] then Color.GREEN else Color.RED);
AddLabel(showlabels, "MACD.Value(" + round(macd_Val_1,1) + ") cross above MACD.Avg(" + Round(macd_Avg1,1) + ") (signal) = " + if round(macd_Val_1,1) > Round(macd_Avg1,1) then "true" else "not true", if round(macd_Val_1,1) > Round(macd_Avg1,1) then Color.GREEN else color.LIGHT_RED);
AddLabel(showlabels, "MACD.Value(" + round(MACDValue_2,1) + ") cross above 0 line = " + if round(MACDValue_2,1) >= 0 then "true" else "not true", if round(MACDValue_2,1) >= 0 then color.GREEN else color.LIGHT_RED);
AddLabel(showlabels, if upmobo and  c < Uppermobo then "MOBO close is between(" + Num_Dev_up + " SD) bands"
  else if upmo then "MOBO is above upper(" + Num_Dev_up + " SD) band"
  else if dnmo then "MOBO is below lower(" + Num_Dev_up + " SD) band"
  else "", Color.GREEN);
AddLabel(showlabels, "RSI(" + RSI_length + ") = " + Round(rsi_here, 1), if RSI_trig then Color.GREEN else Color.RED);
AddLabel(showlabels, "Ichimoku(" + tenkan_period + ", " + kijun_period + "):" + "Tenkan / Kijan = " + Ichimoku().Tenkan + " / " + Ichimoku().kijun, if Ichimoku()."Tenkan" > Ichimoku()."Kijun" then Color.GREEN else Color.RED);
AddLabel(showlabels, "MomentumPercent(" + MomPctLength + ") = " + Round(mom_pct, 2) + " %", if mom_pct >= MOM_Pct_trig then Color.GREEN else Color.RED);
AddLabel(showlabels, "Polarized Fractal Eff(" + PFE_length + ") = " + Round(PFE, 0), if PFE >= PFE_trig then Color.GREEN else Color.RED);
AddLabel(showlabels, "DMI Osc(" + DMIO_Length + ") = " + Round(DMI_OSC_here, 1), if DMI_OSC_here >= DMIO_trig then Color.GREEN else Color.RED);
AddLabel(showlabels, "ADX(" + ADX_Length + ") = " + ADX_here, if ADX_here >= ADX_trig && DMI_Pos then Color.GREEN else Color.RED);
AddLabel(showlabels, "TSI = " + Round(TSI_here,1), if TSI_here >= TSI_Trig then color.GREEN else color.RED);
AddLabel(showlabels, "DYMI(" + DYMI_length + ") = " + Round(DYMI_here, 1), if DYMI_here >= DYMI_trig then Color.GREEN else Color.RED);
#== end ==
 of Code
C-'Ichi_TK_Exit_Warning' --- AN EARLY ICHIMOKU T-K EXIT STUDY
#hint:This is a Ichimoku Tenkan/Kijun an early exit warning study that plots the difference between the tenkan and kijun in histogram format. A YELLOW down warning arrow plots when a Heikin Ashi downtrend starts.
#Background:The difference of the Tenkan and the Kijun indicate the strength of this bullish signal as shown by the histogram above zero values. When this strength difference weakens a downward trend may(often?) start. Heikin Ashi candles are adept at showing trend development. The plotted YELLOW arrows are points to consider exiting even though the entity may be in buillsh territory(i.e. above the cloud). In summary, this is an early warning signal that is productive and calls your attention to it to consider exiting.
#USAGE:When YELLOW down arrows are present, watch the Heikin Ashi style candles to see the extent of the downtrend.(Configure your Heikin Ashi for 'Red Fill' when down. The DMI_Oscillator, MACD and ADX are good complementary studies
#SUMMARY: The histograqm shows  the change in strength of the bullish T/K signal while the YELLOW arrows call your attention to a possible start of a downtrend.
#TOS Title = Ichi_TK_Exit_Warning
# Version date = 3/17/14 by StanL, version 2
# Revision 2.1, added dots at the zero line 5/18/14

declare lower;

input Show_HA_Down = YES;#hint HA_Down:Toggles (ON/OFF) HA-Down-candle arrows showing the start of a HA-Down series. View the HA chart style to see the length of the down series.
#input Show_HA_Up = YES;#hint HA_Up:Toggles (ON/OFF) HA-Up-candle arrows showing the start of a HA-Up series. View the HA chart style to see the length of the up series.

plot Diff = Ichimoku().tenkan - Ichimoku().kijun;
plot ZeroLine = 0;
Diff.SetDefaultColor(GetColor(5));
Diff.SetPaintingStrategy(PaintingStrategy.HISTOGRAM);
Diff.SetLineWeight(3);
Diff.DefineColor("Positive and Up", Color.GREEN);
Diff.DefineColor("Positive and Down", Color.DARK_GREEN);
Diff.DefineColor("Negative and Down", Color.RED);
Diff.DefineColor("Negative and Up", Color.DARK_RED);
Diff.AssignValueColor(if Diff >= 0 then if Diff > Diff[1] then Diff.Color("Positive and Up") else Diff.Color("Positive and Down") else if Diff < Diff[1] then Diff.Color("Negative and Down") else Diff.Color("Negative and Up"));

ZeroLine.SetDefaultColor(GetColor(0));

plot HistoLiner = Diff;
HistoLiner.SetDefaultColor(Color.WHITE);
HistoLiner.SetPaintingStrategy(PaintingStrategy.LINE);
HistoLiner.SetLineWeight(1);

#################################################
#def HAopen = (open[1] + close[1]) / 2;
#def HAhigh = Max(high, close[1]);
#def HAlow = Min(low, close[1]);
#def HAclose = (open + high + low + close) / 4;
AddLabel(1, "Plot of Tenkan - Kijun early warning of T/K strength weakening", Color.WHITE);
AddLabel(1, "A YELLOW down arrow plots at the start of a HA downtrend.Watch the HA style chart candles to see the length of the downtrend", Color.YELLOW);

#######################################
#=== Extracted Mobius Heikin Ashi code #
#######################################

input Begin = 0000;
# Higher Aggregation
def barSeq = if SecondsTillTime(Begin) == 0 and
  SecondsFromTime(Begin) == 0
  then 0
  else barSeq[1] + 1;

def agg = GetAggregationPeriod();
def BarsPerHour = 60 / (agg / 1000 / 60);
def bar = barSeq;
def barCount = if bar % BarsPerHour == 0 then bar else Double.NaN;
def barCountOpen  = if !IsNaN(barCount) then open else barCountOpen[1];
def barCountHigh  = if IsNaN(barCount) and high > barCountHigh[1] then high else if !IsNaN(barCount) then high else barCountHigh[1];
def barCountLow   = if IsNaN(barCount) and low < barCountLow[1] then low else if !IsNaN(barCount) then low else barCountLow[1];
def barCountClose = if !IsNaN(barCount)
  then close[1]
  else barCountClose[1];

def HAopen_EV = Round(if HAopen_EV[1] == 0
then barCountOpen
else (HAopen_EV[1] + barCountClose[1]) / 2 /
TickSize(), 0) * TickSize();

def HAclose_EV = Round(if HAopen_EV[1] == 0
  then OHLC4
  else (barCountOpen + barCountHigh + barCountLow + HAopen_EV[1])
  / 4 / TickSize(), 0) * TickSize();

def HAhigh_EV = Round(Max(barCountHigh, barCountClose[1]) /
  TickSize(), 0) * TickSize();
  def HAlow_EV = Round(Min(barCountLow, barCountClose[1]) /
  TickSize(), 0) * TickSize();

#Color Block For Higher Aggregation
def Size = AbsValue(HAopen_EV - HAopen_EV);
def Block = CompoundValue(1, if HAopen_EV > Block[1] + Size[1]
  then Block[1] + Size
  else if HAopen_EV < Block[1] - Size[1]
  then Block[1] - Size
  else Block[1] , barCountClose);

plot cond1_EV = Block;
cond1_EV.Hide();

def cond2_EV = if Block != Block[1]
  then Block[1]
  else cond2_EV[1];

plot Block2 = cond2_EV;
Block2.Hide();

#AssignPriceColor(if HAclose < HAopen
#                   then Color.Red
#                   else Color.Green);
# Trade Management Conditions
def Bcond = CompoundValue(1, if HAclose_EV crosses above HAopen_EV
  then Bcond[1] + 1
  else if HAclose_EV crosses below HAopen_EV
  then 0
  else Bcond[1], 0);

#UP arrow is the start of an HA-up series.  Need to view HA Chart style to see the extent & end
#plot ArrowUp = if Bcond crosses above 0 && Show_HA_Up && Diff < 0 then HistoLiner[0] else Double.NaN;# this line used when up HA arrows are implemented
plot ArrowUp = if Bcond crosses above 0 && Diff < 0 then HistoLiner[0] else Double.NaN;
ArrowUp.SetPaintingStrategy(PaintingStrategy.ARROW_UP);
ArrowUp.SetLineWeight(5);
ArrowUp.SetDefaultColor(Color.YELLOW);

def Scond = CompoundValue(1, if HAclose_EV crosses below HAopen_EV
  then Scond[1] + 1
  else if barCountClose crosses above HAopen_EV
  then 0
  else Scond[1], 0);

#DOWN arrow is the start of an HA-down series. Need to view HA Chart style to see the extent & end
plot ArrowDn = if Scond crosses above 0 && Show_HA_Down && Diff > 0
  then HistoLiner[0]
  else Double.NaN;

ArrowDn.SetPaintingStrategy(PaintingStrategy.ARROW_DOWN);
ArrowDn.SetLineWeight(5);
ArrowDn.SetDefaultColor(Color.YELLOW);

def lineCond = if ArrowUp < ArrowDn
  then 1
  else if ArrowDn > ArrowUp
  then 1
  else -1;
plot line = if IsNaN(ArrowUp)
  then ArrowDn - (TickSize() * 2)
  else ArrowUp + (TickSize() * 2);

line.EnableApproximation();
line.SetLineWeight(2);
line.SetStyle(Curve.SHORT_DASH);

line.AssignValueColor(if lineCond == 1
  then Color.GREEN
  else if lineCond == -1
  then Color.RED
  else Color.WHITE);

######=== define dot on zero line when above the cloud ######
def IsAboveCloud = if close > Ichimoku()."Span A" && close > Ichimoku()."Span B" then 1 else 0; # close is above the cloud
def IsBelowCloud = if close < Ichimoku()."Span A" && close < Ichimoku()."Span B" then 1 else 0; # close is below the cloud

Plot AboveCloudDot = if IsAboveCloud then 0 else double.nan;
AboveCloudDot.SetPaintingStrategy(PaintingStrategy.POINTS);
AboveCloudDot.SetLineWeight(5);
AboveCloudDot.SetDefaultColor(Color.GREEN);

Plot BelowCloudDot = if IsBelowCloud then 0 else double.nan;
BelowCloudDot.SetPaintingStrategy(PaintingStrategy.POINTS);
BelowCloudDot.SetLineWeight(5);
BelowCloudDot.SetDefaultColor(Color.RED);

#Define variables used to place a bubble
#========================================
def barNum = BarNumber();
def FirstBar = if barNum == 1 then 1 else 0;

#==========================================
AddChartBubble(FirstBar, 0, "GREEN dot = close IS ABOVE CLOUD\nRED dot = close IS BELOW CLOUD",
Color.PINK,no);
#---- End Of Code ---
C-'IchiOneGlance'--ALL MAIN ICHIMOKU CRITERIA IN DASHBOARD FORMAT
#IchiOneGlance Version 1.00 by StanL 5/4/14
#Hint:This shows, in dashboard format, the main criteria used in the Ichimoku. It identifies the bullish, neutral and bearish aspects.
#NOTES: The Ichimoku is a very busy study that can be intimidating. However, once understood, it becomes addictive and very useful since it addresses so many different and pertinent aspects. The Ichimoku is also useful for indicating support and resistance levels but this feature is not addressed herein. The Tenkan and Kijun periods, 9 and 26, are NOT recommended to be changed. Scan coding is shown below the respective items.
#You need to show an expansion area of 30 bars (vis chart settings/time axis/expansion area) to see the projection imto the future that Ichimoku plots.

declare lower;

plot WhiteLabel = Double.NaN;
WhiteLabel.SetDefaultColor(Color.WHITE);

input tenkan_period = 9;#Hint tenkan_period: The number of bars used to calculate the Tenkan (cyan) plot. Default is 9 and should be retained.
input kijun_period = 26;#Hint kijun_period: The number of bars used to calculate the Kijun (pink) plot. Default is 26 and should be retained.
input ShowLabels = YES;#hint ShowLabels:Toggles labels on/off.

def Tenkan_here = Ichimoku(tenkan_period, kijun_period).Tenkan;
def Kijun_here = Ichimoku(tenkan_period, kijun_period).Kijun;
#Define variables used to place a bubble

#========================================
def barNum = BarNumber();
def offset = 50;
def LastBar = !IsNaN(open) and IsNaN(open [-1] ) ;
def BubbleLocation = LastBar[offset];
def FirstBar = if barNum == 1 then 1 else 0;
def FirstBarValue = if barNum == 1 then 1 else 0;
def LastBarValue = if LastBar then barNum else 0;

#example
#addchartbubble(LastBar,45, "This is a last bar bubble", color.White);

#==========================================

#===== Secondary Trend(ST) --- When T > K =======
def ST_Bull = if Ichimoku(tenkan_period, kijun_period).Tenkan > Ichimoku(tenkan_period, kijun_period).Kijun then 1 else 0;

plot TK_line = 20;
TK_line.SetPaintingStrategy(PaintingStrategy.LINE_VS_SQUARES);
TK_line.SetLineWeight(5);
TK_line.SetDefaultColor(Color.White);
TK_line.AssignValueColor(if ST_Bull then Color.UPTICK else if !ST_Bull then Color.DOWNTICK else color.WHITE);

AddChartBubble(FirstBar, 20, " Ichimoku(" + tenkan_period + "," +  kijun_period + "). Secondary trend = bullish when Tenkan > Kijun.", Color.WHITE);

#====== Close is above the cloud (Primary trend = PT)======
def PT_bull = if close > Ichimoku(tenkan_period, kijun_period)."Span A" && close > Ichimoku(tenkan_period, kijun_period)."Span B" then 1 else 0;

plot PT_line = 22;
PT_line.SetPaintingStrategy(PaintingStrategy.LINE_VS_SQUARES);
PT_line.SetLineWeight(5);
PT_line.SetDefaultColor(Color.White);
PT_line.AssignValueColor(if PT_Bull then Color.UPTICK else if IsNaN(open[-1]) then color.WHITE else color.DOWNTICK);

AddChartBubble(FirstBar, 22, " Ichimoku(" + tenkan_period + "," +  kijun_period + ") Primary trend = bullish when the close is above the cloud.", Color.WHITE);

#=== scan code for 'Close above the cloud' (primary Bullish scan)===
#(close is greater than Ichimoku()."Span A" within 2 bars and close is greater than Ichimoku()."Span B" within 2 bars)
#== end of scan code ==

#== end of primary trend ==
#====== Chikou is above the cloud (Tertiary trend = TT)======
Def Chikou_here =  Ichimoku(tenkan_period, kijun_period).Chikou;
def SpanB = Ichimoku(tenkan_period, kijun_period)."Span B";
def SpanA = Ichimoku(tenkan_period, kijun_period)."Span A";
def Chikou_Bull = if Chikou_here > SpanA && Chikou_here > SpanB then 1 else 0;
def TT_Bull = Chikou_Bull;

plot TT_line = 18;
TT_line.SetPaintingStrategy(PaintingStrategy.LINE_VS_SQUARES);
TT_line.SetLineWeight(5);
TT_line.SetDefaultColor(Color.White);
TT_line.AssignValueColor(if TT_Bull  then Color.UPTICK else if !TT_Bull then Color.DOWNTICK else color.blue);
TT_line.AssignValueColor(if Chikou_Bull then color.UPTICK else color.DOWNTICK);

AddChartBubble(FirstBar, 18, " Ichimoku(" + tenkan_period + "," +  kijun_period + ") Tertiary trend = bullish when the Chikou is above the cloud.", Color.WHITE);

#=== scan code for 'Chikou is above the cloud' ===
#Ichimoku()."Chikou" from 26 bars ago is greater than Ichimoku()."Span A" within 2 bars
#=== end of scan code ===

#=== end of Tertiary trend ===

#=========== Presence of powerful 'triple bull' signal ==========
Plot Bull_3X = 16;
Bull_3X.SetPaintingStrategy(PaintingStrategy.LINE_VS_SQUARES);
Bull_3X.SetLineWeight(5);
Bull_3X.SetDefaultColor(Color.White);

def all3 = if ST_Bull && Chikou_Bull && PT_Bull then 1 else 0;

Bull_3X.AssignValueColor(if All3 then color.UPTICK else color.DOWNTICK);

AddChartBubble(FirstBar, 16, " Ichimoku(" + tenkan_period + "," +  kijun_period + ") Triple bullish trend = bullish Primary, Secondary & Tertiary trends. Best trading opportunity(GREEN).", Color.WHITE);

#==== Scan code for Triple Bullish ====(to use remove '#')
#(close is greater than Ichimoku()."Span A" within 2 bars or close is greater than Ichimoku()."Span B" within 2 bars) and
# Ichimoku()."Tenkan" is greater than Ichimoku().Kijun within 2 bars and
# Ichimoku()."Chikou" from 26 bars ago is greater than Ichimoku()."Span A" within 2 bars
#== end of scan code ==

#=== 'triple bull' signal ===

#======== Neutral(no trend) in-cloud signal ========
Plot No_Trend = 14;
No_Trend.SetPaintingStrategy(PaintingStrategy.LINE_VS_SQUARES);
No_Trend.SetLineWeight(5);
No_Trend.SetDefaultColor(Color.White);

Def InCloud = if Between(close, SpanA,SpanB) or Between(close, SpanB,SpanA) then 1 else 0;
No_Trend.AssignValueColor(if InCloud then color.Yellow else color.GRAY);
AddChartBubble(FirstBar, 14, " Ichimoku(" + tenkan_period + "," +  kijun_period + ") Neutral(no trend) signal = close is within the cloud. Trading not recommended.", Color.WHITE);

#====== strength of bullish secondary(T/K) trend ======
input DeclBarsToUse = 3;#hint Bars_Decl:The number of past bars to use to test for declining strength of bullish T/K signal.This triggers the yellow indication. Refrain from large values. 1 to 3 is good.

plot Bull_Strength = 12;
Bull_Strength.SetPaintingStrategy(PaintingStrategy.LINE_VS_SQUARES);
Bull_Strength.SetLineWeight(5);
Bull_Strength.SetDefaultColor(Color.White);

Def diff = Ichimoku(tenkan_period, kijun_period).Tenkan - Ichimoku(tenkan_period, kijun_period).Kijun;
def Decline = If ST_Bull && Sum(diff < diff[1],DeclBarsToUse) == DeclBarsToUse then 1 else 0; #Declining difference in the last ? bars of a bullish secondary trend
Bull_Strength.AssignValueColor(if decline then color.Yellow else color.GRAY);

AddChartBubble(FirstBar, 12, " Ichimoku(" + tenkan_period + "," +  kijun_period + ") Trigger = Declining Bullish secondary(T>K) trend for last " + DeclBarsToUse + " bars = yellow else gray for no decline.", Color.WHITE);

#==== Labels ====
AddLabel(Showlabels && !InCloud ,if close > Ichimoku(tenkan_period, kijun_period)."Span A" && close > Ichimoku(tenkan_period, kijun_period)."Span B" then "Bullish 'close is above the cloud' is true" else "Bullish Primary signal is false",if close > Ichimoku(tenkan_period, kijun_period)."Span A" && close > Ichimoku(tenkan_period, kijun_period)."Span B" then color.UPTICK else color.Downtick);

AddLabel(Showlabels && !InCloud ,if ST_Bull then "Bullish 'Tenkan > Kijun' is true" else "Bullish 'Tenkan is > Kijun' is false", if ST_Bull then color.UPTICK else color.DOWNTICK);

AddLabel(Showlabels && !InCloud ,if close > SpanA[26] && close > SpanB[26] then "Bullish 'Chikou is above the cloud' is true" else "Bullish 'Chikou is above the cloud' is false", if close > SpanA[26] && close > SpanB[26] then color.UPTICK else color.DOWNTICK);

AddLabel(Showlabels && !InCloud , if ST_Bull && TT_Bull[26] && PT_Bull then "A powerful 3XBullish signal exists" else "A powerful 3XBullish signal does not exists",if ST_Bull && TT_Bull[26] && PT_Bull then color.UPTICK else color.DOWNTICK);

AddLabel(Showlabels && InCloud, "The close is inside the cloud. No trading recommended here. All other labels are suspended. Look for a signal on exiting the cloud.",Color.MAGENTA);
#=== end of IchiOneGlance ===
C-'Ichi_Signals' — IDENTIFIES ALL MAJOR ICHIMOKU SIGNALS FOR LEARNING OR USE
##Hint:This Ichmoku study has many signals. Some are more important/controlling than others. This study allows you to select the type of signal you are interested in, the strength level of those signals and the bullish or bearish sentiment.The appropriate arrows will be plotted with optional bubbles to identify the signal strength and bull/bear.
# TOS title = 'Ichi_Signals' by StanL version 1.0
#USAGE NOTES: !.All Bullish signals are UP arrows of cyan coloring. All Bearish signals are DOWN arrows of magenta coloring.
#2.Bubbles may be toggled OFF to avoid chart clutter. All bubbles are colored white for readability.
#3.Selectable inputs for arrow plotting are:1. Each of the 5 Ichimoku parameters(lines); 2.Signal strengths of strong, neutral, weak or All;3.Bullish, Bearish or All.
# The main Ichimoku signals to monitor, in order of importance, are:
#   1. Price vs Cloud (the 'big picture')
#   2. Price vs Tenkan/Kijun
#   3. Momentum
#   4. Future Cloud
#These signals are not 'stand alone' for decision making and must be evaluated using other related ichimoku data as well as other external studies and indicators.
#A free detailed reference, 'Ichmoku E-Book', is available at https://www.ichimokutrade.com/c/videos/categories/ichimoku-videos/ as well as a tutorial at http://www.kumotrader.com/ichimoku_wiki/index.php?title=Ichimoku_components
#The E-Book has details for developing buy/sell strategies using the Ichimoku signals.

input ShowBubbles = yes;#Hint ShowBubbles:Toggles bubbles ON/OFF
input ShowColorLabels = Yes;#hint ShowColorLabels:Toggles the color coding labels ON/OFF
input tenkan_period = 9;#Hint tenkan_period: The number of bars used to calculate the Tenkan cyan plot. Default is 9. Change of this value is not recommended.
input kijun_period = 26;#Hint kijun_period: The number of bars used to calculate the Kijun pink plot. Default is 26. Change of this value is not recommended.
input Type_Signal = {default "T/K Cross", "Kijun Cross", "Cloud BreakOut", "SpanA/B Cross", "Chikou Cross"};#Hint Type_Signal:Select the type of signal to show. All is not a choice because there would be too many signals to show. Each choice could have up to 6 signals i.e. Bullish/Bearish, Strong, Neutral & Weak signals.
input Signal_strength = {default Strong, Neutral, Weak, All};#hint Signal_strength:Show only signals having the strength selected
input Bullish_Bearish = {default Bullish, Bearish, Both};#hint Bullish_Bearish:Select the orientation desired

plot Tenkan = (Highest(high, tenkan_period) + Lowest(low, tenkan_period)) / 2;
plot Kijun = (Highest(high, kijun_period) + Lowest(low, kijun_period)) / 2;
plot "Span A" = (Tenkan[kijun_period] + Kijun[kijun_period]) / 2;
plot "Span B" = (Highest(high[kijun_period], 2 * kijun_period) + Lowest(low[kijun_period], 2 * kijun_period)) / 2;
plot Chikou = close[-kijun_period];
Tenkan.SetDefaultColor(GetColor(1));
#Kijun.SetDefaultColor(GetColor(2));
"Span A".SetDefaultColor(GetColor(3));
"Span B".SetDefaultColor(GetColor(4));
Chikou.SetDefaultColor(GetColor(5));
DefineGlobalColor("Bullish", Color.GREEN);
DefineGlobalColor("Bearish", Color.RED);
AddCloud("Span A", "Span B", GlobalColor("Bullish"), GlobalColor("Bearish"));

#=== Define global colors ===
# aqua is bullish & ARROW_UP
DefineGlobalColor("BullStrong", CreateColor(82, 242, 234));#light aqua
DefineGlobalColor("BullNeutral", CreateColor(155, 215, 213));#medium aqua
DefineGlobalColor("BullWeak", CreateColor(36, 179, 172));#dark aqua
#magenta tint is bearish & ARROW_DOWN
DefineGlobalColor("BearStrong", CreateColor(255, 0, 255));#light = magenta
DefineGlobalColor("BearNeutral", CreateColor(221, 160, 221));#medium plum
DefineGlobalColor("BearWeak", CreateColor(186, 85, 211));#med orchid
#DefineGlobalColor("Global1", CreateColor(128, 0, 128));
#?.SetDefaultColor(GlobalColor("?"));

#=== BASIC CONDITIONS ====
def IsAboveCloud = if close > Ichimoku()."Span A" && close > Ichimoku()."Span B" then 1 else 0; # close is above the cloud
def IsBelowCloud = if close < Ichimoku()."Span A" && close < Ichimoku()."Span B" then 1 else 0; # close is below the cloud
def IsInCloud = if (("Span A" > "Span B" && close[0] < "Span A" && close[0] > "Span B") or ("Span B" > "Span A" &&
close[0] > "Span A" && close[0] < "Span B"),1,0);#This code has been analyzed & proven accurate
#def IsInCloud = If close > Min(Ichimoku()."Span A",Ichimoku()."Span B") && close < Max(Ichimoku()."SpanA",Ichimoku()."Span B") then 1 else 0;# Close is in the cloud
#def IsInCloud = if close > Min("Span A", "Span B") && close < Max("Span A", "Span B") then 1 else 0;# Close is in the cloud
def want_Strong = if Signal_strength == Signal_strength."Strong" or Signal_strength == Signal_strength."All" then 1 else 0;
def  want_Neutral = if Signal_strength == Signal_strength."Neutral" or Signal_strength == Signal_strength."All" then 1 else 0;
def  want_Weak = if Signal_strength == Signal_strength."Weak" or Signal_strength == Signal_strength."All" then 1 else 0;
def want_Bull = if Bullish_Bearish == Bullish_Bearish."Bullish" or  Bullish_Bearish == Bullish_Bearish."Both" then 1 else 0;
def want_Bear = if Bullish_Bearish == Bullish_Bearish."Bearish" or  Bullish_Bearish == Bullish_Bearish."Both" then 1 else 0
;
###############################################
#==== TENKAN/KIJUN (T/K) CROSS SIGNALS ====   #
#The tenkan/kijun cross is one of the most traditional trading strategies within the Ichimoku system.

###############################################
def Is_TKC = if  Type_Signal == Type_Signal."T/K Cross" then 1 else 0;
=== === BULLISH SIGNALS == T crosses above the K ====
#===================================================
#===      === STRONG T/K Bullish cross happens while ABOVE the cloud ===
def cond_STK = Crosses(Tenkan, Kijun, CrossingDirection.ABOVE) && IsAboveCloud;

plot STK_Cross = If (cond_STK && Is_TKC &&  want_Strong && want_Bull , Tenkan, Double.NaN);
STK_Cross.SetPaintingStrategy(PaintingStrategy.ARROW_UP);
STK_Cross.SetLineWeight(5);
STK_Cross.SetDefaultColor(GlobalColor("BullStrong"));

AddChartBubble(ShowBubbles && cond_STK && Is_TKC &&  want_Strong && want_Bull , Tenkan, "strong\nbullish", Color.WHITE, yes);

###=== NEUTRAL T/K cross(NTKC)happens while IN the cloud ===
def cond_NTKC = Crosses(Tenkan, Kijun, CrossingDirection.ABOVE) && IsInCloud;

plot NTK_Cross = If(cond_NTKC && Is_TKC &&  want_Neutral && want_Bull , Tenkan, Double.NaN);
NTK_Cross.SetPaintingStrategy(PaintingStrategy.ARROW_UP);
NTK_Cross.SetLineWeight(5);
NTK_Cross.SetDefaultColor(GlobalColor("BullNeutral"));

AddChartBubble(ShowBubbles && cond_NTKC && Is_TKC && want_Neutral && want_Bull , Tenkan, "neutral\nbullish", Color.WHITE, yes);

###=== WEAK cross T/K(WTKC) happens while BELOW the cloud ===
def cond_WTKC = Crosses(Tenkan, Kijun, CrossingDirection.ABOVE) && IsBelowCloud;

plot WTK_Cross = If(cond_NTKC && Is_TKC && want_Bull && want_Weak, Tenkan, Double.NaN);
WTK_Cross.SetPaintingStrategy(PaintingStrategy.ARROW_UP);
WTK_Cross.SetLineWeight(5);
WTK_Cross.SetDefaultColor(GlobalColor("BullWeak"));

AddChartBubble(ShowBubbles && cond_NTKC && Is_TKC && want_Bull && want_Weak, Tenkan, "weak\nbullish", Color.WHITE, yes);

##=== BEARISH SIGNALS == T crosses below the K (K/T)====
##############################################
#===      === STRONG K/T bearish cross happens while BELOW the cloud===
def cond_SKT_Cross = Crosses(Tenkan, Kijun, CrossingDirection.BELOW) && IsBelowCloud;

plot SKT_Cross = If(cond_SKT_Cross && Is_TKC &&  want_Strong && want_Bear, Tenkan, Double.NaN);
SKT_Cross.SetPaintingStrategy(PaintingStrategy.ARROW_DOWN);
SKT_Cross.SetLineWeight(5);
SKT_Cross.SetDefaultColor(CreateColor(255, 0, 255));

AddChartBubble(ShowBubbles &&  cond_SKT_Cross && Is_TKC &&  want_Strong && want_Bear , Tenkan, "strong\nbearish",  Color.WHITE, yes);

###=== NEUTRAL cross K/T happens while IN the cloud ===
def cond_NKT_Cross =  Crosses(Tenkan, Kijun, CrossingDirection.BELOW) && IsInCloud;

plot NKT_Cross =  If(cond_NKT_Cross && Is_TKC && want_Neutral && want_Bear, Tenkan, Double.NaN);
NKT_Cross.SetPaintingStrategy(PaintingStrategy.ARROW_DOWN);
NKT_Cross.SetLineWeight(5);
NKT_Cross.SetDefaultColor(CreateColor(221, 160, 221));

AddChartBubble(ShowBubbles && cond_NKT_Cross && Is_TKC && want_Neutral && want_Bear , Tenkan, "neutral\nbearish",  Color.WHITE, yes);

#===      === WEAK cross K/T happens while ABOVE the cloud  ===
def Cond_WKT_Cross = Crosses(Tenkan, Kijun, CrossingDirection.BELOW) && IsAboveCloud;

plot WKT_Cross = If (Cond_WKT_Cross && Is_TKC && want_Weak && want_Bear, Tenkan, Double.NaN);
WKT_Cross.SetPaintingStrategy(PaintingStrategy.ARROW_DOWN);
WKT_Cross.SetLineWeight(5);
WKT_Cross.SetDefaultColor(CreateColor(186, 85, 211));

AddChartBubble(ShowBubbles && Cond_WKT_Cross && Is_TKC && want_Weak && want_Bear , Tenkan,"Weak\nbearish",  Color.WHITE, no);

#####################################
#==== KIJUN CROSS SIGNALS ====     ##
#The kijun cross is one of the most powerful and reliable trading strategies within the Ichimoku system. It can be used on nearly all time frames with excellent results, though it will be somewhat less reliable on the lower, daytrading time frames due to the increased volatility on those time frames.
#####################################
def is_KC = if Type_Signal == Type_Signal."Kijun Cross" then 1 else 0;
=== === BULLISH SIGNALS when close crosses above the Kijun
#######################################
#===      === BULL & STRONG ===
def is_KC_bull_strong = Crosses(close, Kijun, CrossingDirection.ABOVE) && IsAboveCloud;

plot KC_Strong_Bull = If (is_KC_bull_strong && is_KC &&  want_Strong && want_Bull, Kijun, Double.NaN);
KC_Strong_Bull.SetPaintingStrategy(PaintingStrategy.ARROW_UP);
KC_Strong_Bull.SetLineWeight(5);
KC_Strong_Bull.SetDefaultColor(GlobalColor("BullStrong"));

AddChartBubble(ShowBubbles && is_KC_bull_strong && is_KC &&  want_Strong && want_Bull , Kijun, "strong\nbullish",Color.WHITE, yes);

#===      === BULL & NEUTRAL ===
def is_KC_bull_neutral = Crosses(close, Kijun, CrossingDirection.ABOVE) && IsInCloud;

plot KC_neutral_Bull = If (is_KC_bull_neutral && is_KC && want_Neutral && want_Bull, Kijun, Double.NaN);
KC_neutral_Bull.SetPaintingStrategy(PaintingStrategy.ARROW_UP);
KC_neutral_Bull.SetLineWeight(5);
KC_neutral_Bull.SetDefaultColor(GlobalColor("BullNeutral"));

AddChartBubble(ShowBubbles && is_KC_bull_neutral && is_KC && want_Neutral && want_Bull , Kijun, "neutral\nbullish", Color.WHITE, yes);

#===      === BULL & WEAK ===
def is_KC_bull_weak = Crosses(close, Kijun, CrossingDirection.ABOVE) && IsBelowCloud;

plot KC_weak_Bull = If (is_KC_bull_weak && is_KC && want_Weak && want_Bull, Kijun, Double.NaN);
KC_weak_Bull.SetPaintingStrategy(PaintingStrategy.ARROW_UP);
KC_weak_Bull.SetLineWeight(5);
KC_weak_Bull.SetDefaultColor(GlobalColor("BullWeak"));

AddChartBubble(ShowBubbles && is_KC_bull_weak && is_KC && want_Weak && want_Bull , Kijun, "weak\nbullish",Color.WHITE, yes);

=== === BEARISH SIGNALS when close crosses below the Kijun
####################################
#===      === BEAR & STRONG ===
def is_KC_bear_strong = Crosses(close, Kijun, CrossingDirection.BELOW) && IsBelowCloud;

plot KC_strong_Bear = If (is_KC_bear_strong && is_KC &&  want_Strong && want_Bear, Kijun, Double.NaN);
KC_strong_Bear.SetPaintingStrategy(PaintingStrategy.ARROW_DOWN);
KC_strong_Bear.SetLineWeight(5);
KC_strong_Bear.SetDefaultColor(GlobalColor("BearStrong"));

AddChartBubble(ShowBubbles && is_KC_bear_strong && is_KC &&  want_Strong && want_Bear , Kijun,"strong\nbearish",  Color.WHITE, yes);

#===      === BEAR & NEUTRAL ===
def is_KC_bear_neutral = Crosses(close, Kijun, CrossingDirection.BELOW) && IsInCloud;

plot KC_neutral_Bear = If (is_KC_bear_neutral && is_KC && want_Neutral && want_Bear, Kijun, Double.NaN);
KC_strong_Bear.SetPaintingStrategy(PaintingStrategy.ARROW_DOWN);
KC_strong_Bear.SetLineWeight(5);
KC_strong_Bear.SetDefaultColor(GlobalColor("BearNeutral"));

AddChartBubble(ShowBubbles && is_KC_bear_neutral && is_KC && want_Neutral && want_Bear, Kijun, "neutral\nbearish",  Color.WHITE, yes);

#===      === BEAR & WEAK ===
def is_KC_bear_weak = Crosses(close, Kijun, CrossingDirection.BELOW) && IsAboveCloud;

plot KC_weak_Bear = If (is_KC_bear_weak && is_KC && want_Weak && want_Bear, Kijun, Double.NaN);
KC_weak_Bear.SetPaintingStrategy(PaintingStrategy.ARROW_DOWN);
KC_weak_Bear.SetLineWeight(5);
KC_weak_Bear.SetDefaultColor(GlobalColor("Bearweak"));

AddChartBubble(ShowBubbles && is_KC_bear_weak && is_KC && want_Weak && want_Bear, Kijun, "weak\nbearish", Color.WHITE, yes);

#################################
#==== CLOUD BREAKOUT SIGNALS ====  ##
#CLOUD BREAKOUT trading is a trading strategy that can be used on multiple time frames, though it is most widely used on the higher time frames (e.g.: Daily, Weekly, Monthly). CLOUD breakout trading is the purest form of trend trading offered by the Ichimoku charting system, as it looks solely to the CLOUD and price's(close) relationship to it for its signals. It is "big picture" trading that focuses only on whether price is trading above or below the prevailing CLOUD. . In a nutshell, the signal to go long in CLOUD BREAKOUT trading is when price closes above the prevailing CLOUD and, likewise, the signal to go short is when price closes below the prevailing CLOUD.

#############################
def is_CBO = if Type_Signal == Type_Signal."Cloud BreakOut" then 1 else 0;
=== === BULLISH SIGNALS ===
###########################
#A bullish signal is present when the close moves above the cloud. Caution is needed if close is rising above a flat-top- cloud (a persistent resistance). The position of the close related to the cloud is the most controlling aspect of signal evaluation.....it is the 'Big Picture'.
def SpanA_OnTop = if ("Span A" > "Span B",1,0);
def isCBO_bull_aboveA = if "Span A" > "Span B" && crosses(close,"Span A",CrossingDirection.ABOVE) then 1 else 0;
def isCBO_bull_aboveB = if "Span B" > "Span A" && crosses(close,"Span B",CrossingDirection.ABOVE) then 1 else 0;

plot CBO_Bull_Strong = if (isCBO_bull_aboveA or isCBO_bull_aboveB) && is_CBO &&  want_Strong && want_Bull then close else Double.Nan;
CBO_Bull_Strong.SetPaintingStrategy(PaintingStrategy.ARROW_UP);
CBO_Bull_Strong.SetLineWeight(5);
CBO_Bull_Strong.SetDefaultColor(GlobalColor("BullStrong"));

#def is_FlatTop = If (isCBO_bull_cross && SpanA_OnTop && Sum("Span A" > .90 * "Span A"[1], 8) >= 5, 1, 0) or
if(isCBO_bull_cross && !SpanA_OnTop && sum("Span B" > .95 * "Span B"[1],8) >= 5 ,1,0);
#def SpanA_FlatTop = If (isCBO_bull_cross && SpanA_OnTop && Sum("Span A" ==  "Span A"[1], 8) >= 5, 1, 0);
#def SpanB_FlatTop = If (isCBO_bull_cross && !SpanA_OnTop && Sum("Span B" ==  "Span B"[1], 8) >= 5, 1, 0);
AddChartBubble(ShowBubbles && (isCBO_bull_aboveA or isCBO_bull_aboveB) && is_CBO &&  want_Strong && want_Bull,close,"strong\nbullish", Color.WHITE, yes);

=== === BEARISH SIGNALS ===
###########################
#===      === BEAR & STRONG ===
def isCBO_strong_bearA = if "Span A" < "Span B" && crosses(close,"Span A",CrossingDirection.BELOW) then 1 else 0;
def isCBO_strong_bearB = if "Span B" < "Span A" && crosses(close,"Span B",CrossingDirection.BELOW) then 1 else 0;
plot CBO_Bear_Strong = if (isCBO_strong_bearA or isCBO_strong_bearB) && is_CBO &&  want_Strong && want_Bear then close else Double.Nan;
CBO_Bear_Strong.SetPaintingStrategy(PaintingStrategy.ARROW_DOWN);
CBO_Bear_Strong.SetLineWeight(5);
CBO_Bear_Strong.SetDefaultColor(GlobalColor("BearStrong"));

AddChartBubble(ShowBubbles && (isCBO_strong_bearA or isCBO_strong_bearB) && is_CBO &&  want_Strong && want_Bear,close,"strong\nbearish", Color.WHITE, yes);
##################################################
#==== 'SPAN A' & 'SPAN B' CROSS SIGNALS (SpanAD)====     ###
#The 'Span A' and 'Span B' cross is one of the lesser known trading strategies within the Ichimoku system. This is mostly due to the fact that the 'Span A' cross tends to be more commonly used as an additional confirmation with other trading strategies rather than being used as a standalone trading strategy in its own right. it is best employed on the longer time frames of the Daily chart and above. Keep in mind with the Span crossings is that the "cross" signal will take place 26 periods ahead of the price action as the CLOUD is time-shifted 26 periods into the future.

##################################################
def is_SpanAB = if Type_Signal == Type_Signal."SpanA/B Cross" then 1 else 0;

=== === BULLISH SIGNALS ===
###########################
#===   === SpanAB BULL & STRONG === Close[26] is above the cloud when cross happens
Def is_SpanAB_Cross = if crosses("Span A","Span B", CrossingDirection.ABOVE) then 1 else 0;
def isSpanAB_AboveCloud_26 = if close[26] > "Span A"[26] && close[26] > "Span B"[26]then 1 else 0;#close[26] is above the cloud

Plot SpanAB_StrongBull = if is_SpanAB_Cross && isSpanAB_AboveCloud_26 && is_SpanAB &&  want_Strong && want_Bull  then "Span A" else Double.Nan;
SpanAB_StrongBull.SetPaintingStrategy(PaintingStrategy.ARROW_UP);
SpanAB_StrongBull.SetLineWeight(5);
SpanAB_StrongBull.SetDefaultColor(GlobalColor("BullStrong"));

AddChartBubble(ShowBubbles && is_SpanAB_Cross && isSpanAB_AboveCloud_26 && is_SpanAB &&  want_Strong && want_Bull,"Span A","strong\nbullish", Color.WHITE, yes);
#def Cond_VertLine = if is_SpanAB_Cross && isSpanAB_AboveCloud_26 && is_SpanAB &&  want_Strong && want_Bull then barnumber() - 26 else Double.Nan;
#AddVerticalLine(boolean visible, Any text, CustomColor color, int stroke);
AddVerticalLine(SpanAB_StrongBull[-26],"price  RE  the following SpanA Cross",color.cyan,Curve.SHORT_DASH);

###=== BULL & NEUTRAL ===
# This signal happens infrequently
def IsInCloud_26 = if (("Span A"[26] > "Span B"[26] && close[26] < "Span A"[26] && close[26] > "Span B"[26]) or ("SpanB"[26] > "Span A"[26] && close[26] > "Span A"[26] && close[26] < "Span B"[26]),1,0);#Proven InCloud code shifte 26 bars back for the SpanAB signals only

def isSpanAB_NeutralCross = is_SpanAB_Cross && IsInCloud_26;
Plot SpanAB_NeutralBull = if is_SpanAB_Cross && IsInCloud_26 && is_SpanAB && want_neutral && want_Bull then "Span A" else Double.Nan;
SpanAB_NeutralBull.SetPaintingStrategy(PaintingStrategy.ARROW_UP);
SpanAB_NeutralBull.SetLineWeight(5);
SpanAB_NeutralBull.SetDefaultColor(GlobalColor("BullNeutral"));

AddChartBubble(ShowBubbles && is_SpanAB_Cross && IsInCloud_26 && is_SpanAB && want_neutral && want_Bull ,"Span A","neutral\nbullish", Color.WHITE, yes);
AddVerticalLine(SpanAB_NeutralBull[-26],"price  RE  the following SpanA Cross",color.cyan,Curve.SHORT_DASH);

###=== SpanAS BULL & WEAK ===
def isSpanAB_BelowCloud_26 = close[26] < "Span A"[26] && close[26] < "Span B"[26];
Plot SpanAB_WeakBull = if is_SpanAB_Cross && is_SpanAB && isSpanAB_BelowCloud_26 && want_weak && want_Bull then "Span A" else Double.Nan;
SpanAB_WeakBull.SetPaintingStrategy(PaintingStrategy.ARROW_UP);
SpanAB_WeakBull.SetLineWeight(5);
SpanAB_WeakBull.SetDefaultColor(GlobalColor("Bullweak"));

AddChartBubble(ShowBubbles &&  is_SpanAB_Cross && is_SpanAB && isSpanAB_BelowCloud_26 && want_weak && want_Bull,"Span A","weak\nbullish", Color.WHITE, yes);
#AddVerticalLine(boolean visible, Any text, CustomColor color, int stroke);
AddVerticalLine(SpanAB_WeakBull[-26],"price  RE  the following SpanA Cross",color.cyan,Curve.SHORT_DASH);

##===  SpanAS BEARISH SIGNALS ===
###########################
#def is_SpanAB = if Type_Signal == Type_Signal."SpanA/B Cross" then 1 else 0;
#A bearish signal is when Span A crosses below Span B (or Span B crosses above Span A)
def SpanAS_Bearish_Cross = if crosses("Span A","Span B", CrossingDirection.BELOW) then 1 else 0;

###=== SpanAS BEAR & STRONG ===
######################################
#def isSpanAB_AboveCloud_26 = if close[26] > "Span A"[26] && close[26] > "Span B"[26]then 1 else 0;#close[26] is above the cloud
Plot SpanAB_StrongBear = if SpanAS_Bearish_Cross && isSpanAB_BelowCloud_26 && is_SpanAB &&  want_Strong && want_Bear  then "Span B" else Double.Nan;
SpanAB_StrongBear.SetPaintingStrategy(PaintingStrategy.ARROW_DOWN);
SpanAB_StrongBear.SetLineWeight(5);
SpanAB_StrongBear.SetDefaultColor(GlobalColor("BearStrong"));

AddChartBubble(ShowBubbles && SpanAS_Bearish_Cross && isSpanAB_BelowCloud_26 && is_SpanAB &&  want_Strong && want_Bear,"Span B","strong\nbearish", Color.WHITE, no);
AddVerticalLine(SpanAB_StrongBear[-26],"price  RE  the previous Span B/A Cross",color.cyan,Curve.SHORT_DASH);

###=== SpanAS BEAR & NEUTRAL ===
#########################################
#def isSpanAB_AboveCloud_26 = if close[26] > "Span A"[26] && close[26] > "Span B"[26]then 1 else 0;#close[26] is above the cloud
Plot SpanAB_NeutralBear = if SpanAS_Bearish_Cross && IsInCloud_26 && is_SpanAB &&  want_Neutral && want_Bear then "Span B" else Double.Nan;
SpanAB_NeutralBear.SetPaintingStrategy(PaintingStrategy.ARROW_DOWN);
SpanAB_NeutralBear.SetLineWeight(5);
SpanAB_NeutralBear.SetDefaultColor(GlobalColor("BearNeutral"));

AddChartBubble(ShowBubbles && SpanAS_Bearish_Cross && IsInCloud_26 && is_SpanAB &&  want_Neutral && want_Bear ,"Span B","Neutral\nbearish", Color.WHITE, no);

AddVerticalLine(SpanAB_NeutralBear[-26],"price  RE  the previous Span B/A Cross",color.cyan,Curve.SHORT_DASH);

###=== SpanAS BEAR & WEAK ===
#########################################
#def isSpanAB_AboveCloud_26 = if close[26] > "Span A"[26] && close[26] > "Span B"[26]then 1 else 0;#close[26] is above the cloud
Plot SpanAB_WeakBear = if SpanAS_Bearish_Cross && isSpanAB_AboveCloud_26 && is_SpanAB &&  want_Weak && want_Bear  then "Span B" else Double.Nan;
SpanAB_WeakBear.SetPaintingStrategy(PaintingStrategy.ARROW_DOWN);
SpanAB_WeakBear.SetLineWeight(5);
SpanAB_WeakBear.SetDefaultColor(GlobalColor("BearWeak"));

AddChartBubble(ShowBubbles && SpanAS_Bearish_Cross && isSpanAB_AboveCloud_26 && is_SpanAB &&  want_Weak && want_Bear,"Span B","Weak\nbearish", Color.WHITE, no);
AddVerticalLine(SpanAB_WeakBear[-26],"price  RE  the previous Span B/A Cross",color.cyan,Curve.SHORT_DASH);

###########################################
#==== CHIKOU CROSS(CC) SIGNALS  ====  ##
#chikou cross is essentially the "chikou confirmation" that savvy Ichimoku traders utilize to confirm chart sentiment before entering any trade. This confirmation comes in the form of the chikou crossing through the price curve in the direction of the proposed trade. If it crosses through the price curve from the bottom up, then it is a bullish signal. If it crosses from the top down, then it is considered a bearish signal.
############################################
def is_ChikouCross = if Type_Signal == Type_Signal."Chikou Cross" then 1 else 0;
=== ===CHIKOU CROSS BULLISH SIGNALS ===

###########################
#Bullish = Chikou crsses above close.Strong when close is above the cloud.
def ChikouCross_Bull = if Crosses(Chikou,close, CrossingDirection.ABOVE) then 1 else 0;

####=== CHIKOU CROSS BULL & STRONG ===
plot CC_Strong_Bull = If (is_ChikouCross && ChikouCross_Bull && IsAboveCloud &&  want_Strong && want_Bull, Chikou, Double.NaN);
CC_Strong_Bull.SetPaintingStrategy(PaintingStrategy.ARROW_UP);
CC_Strong_Bull.SetLineWeight(5);
CC_Strong_Bull.SetDefaultColor(GlobalColor("BullStrong"));

AddChartBubble(ShowBubbles && is_ChikouCross && ChikouCross_Bull && IsAboveCloud &&  want_Strong && want_Bull, Chikou, "strong\nbullish",  Color.WHITE, yes);

###=== CHIKOU CROSS BULL & NEUTRAL ===
plot CC_Neutral_Bull = If (is_ChikouCross && ChikouCross_Bull && IsInCloud &&  want_Neutral && want_Bull, Chikou,
Double.NaN);
CC_Neutral_Bull.SetPaintingStrategy(PaintingStrategy.ARROW_UP);
CC_Neutral_Bull.SetLineWeight(5);
CC_Neutral_Bull.SetDefaultColor(GlobalColor("BullNeutral"));

AddChartBubble(ShowBubbles && is_ChikouCross && ChikouCross_Bull && IsInCloud &&  want_Neutral && want_Bull, Chikou, "neutral\nbullish",  Color.WHITE, yes);

###=== CHIKOU CROSS BULL & WEAK ===
plot CC_Weak_Bull = If (is_ChikouCross && ChikouCross_Bull && IsBelowCloud &&  want_Weak && want_Bull, Chikou, Double.NaN);
CC_Weak_Bull.SetPaintingStrategy(PaintingStrategy.ARROW_UP);
CC_Weak_Bull.SetLineWeight(5);
CC_Weak_Bull.SetDefaultColor(GlobalColor("BullWeak"));

AddChartBubble(ShowBubbles && is_ChikouCross && ChikouCross_Bull && IsBelowCloud &&  want_Weak && want_Bull, Chikou, "weak\nbullish",  Color.WHITE, yes);

##===  CHIKOU CROSS BEARISH SIGNALS ===
###########################
#         === Chikou Cross Bear & strong ====
#Bearish = Chokou crosses below the close
#===      === CHIKOU CROSS BEAR & STRONG ===
def ChikouCross_Bear = if Crosses(Chikou,close, CrossingDirection.BELOW) then 1 else 0;
plot CC_Strong_Bear = If (is_ChikouCross && ChikouCross_Bear && IsBelowCloud &&  want_Strong && want_BEAR, Chikou, Double.NaN);
CC_Strong_Bear.SetPaintingStrategy(PaintingStrategy.ARROW_DOWN);
CC_Strong_Bear.SetLineWeight(5);
CC_Strong_Bear.SetDefaultColor(GlobalColor("BearStrong"));

AddChartBubble(ShowBubbles && is_ChikouCross && ChikouCross_Bear && IsBelowCloud &&  want_Strong && want_BEAR, Chikou, "strong\nbearish",  Color.WHITE, no);

#===      === CHIKOU CROSS BEAR & NEUTRAL ===
plot CC_Neutral_Bear = If (is_ChikouCross && ChikouCross_Bear && IsInCloud &&  want_Neutral && want_BEAR, Chikou, Double.NaN);
CC_Neutral_Bear.SetPaintingStrategy(PaintingStrategy.ARROW_DOWN);
CC_Neutral_Bear.SetLineWeight(5);
CC_Neutral_Bear.SetDefaultColor(GlobalColor("BearNeutral"));

AddChartBubble(ShowBubbles && is_ChikouCross && ChikouCross_Bear && IsInCloud &&  want_Neutral && want_BEAR, Chikou, "Neutral\nbearish",  Color.WHITE, no);

#===      === CHIKOU CROSS BEAR & WEAK ===
plot CC_Weak_Bear = If (is_ChikouCross && ChikouCross_Bear && IsAboveCloud &&  want_Weak && want_BEAR, Chikou, Double.NaN);
CC_Weak_Bear.SetPaintingStrategy(PaintingStrategy.ARROW_DOWN);
CC_Weak_Bear.SetLineWeight(5);
CC_Weak_Bear.SetDefaultColor(GlobalColor("BearWeak"));

AddChartBubble(ShowBubbles && is_ChikouCross && ChikouCross_Bear && IsAboveCloud &&  want_Weak && want_BEAR, Chikou, "Weak\nbearish",  Color.WHITE, no);

#====== LABELS ========
#AddLabel(ShowColorLabels, "Strong Bullish", CreateColor(82, 242, 234));#aqua
#AddLabel(ShowColorLabels, "Neutral Bullish", CreateColor(155, 215, 213));#medium aqua
#AddLabel(ShowColorLabels, "Weak Bullish", CreateColor(36, 179, 172));#dark aqua
#AddLabel(ShowColorLabels, "Strong Bearish", CreateColor(255, 0, 255));#light = magenta
#AddLabel(ShowColorLabels, "Neutral Bearish", CreateColor(221, 160, 221));#medium plum
#AddLabel(ShowColorLabels, "Weak Bearish", CreateColor(186, 85, 211));#med orchid orchid

#==== Coding of labels for input-type of signals selected =======
AddLabel(yes, "The type of signal selected is " + (if Type_Signal == Type_Signal."T/K Cross" then "'Tenkan/Kijun Cross'"
  else if Type_Signal == Type_Signal."Kijun Cross" then "'Kijun Cross'"
  else if Type_Signal == Type_Signal."Cloud BreakOut" then "'Cloud BreakOut'"
  else if Type_Signal == Type_Signal."SpanA/B Cross" then "'SpanA/B Cross'"
  else if Type_Signal == Type_Signal."Chikou Cross" then "'Chikou Cross'"
  else ""), Color.WHITE);
AddLabel(yes, "The signal strength selected is " + (if Signal_strength == Signal_strength."Strong" then "'Strong'"
  else if Signal_strength == Signal_strength."Neutral" then "'Neutral'"
  else if Signal_strength == Signal_strength."Weak" then "'Weak'"
  else if Signal_strength == Signal_strength."All" then "'All'"
  else ""), Color.WHITE);
AddLabel(yes, "The bullish/bearish sentiment selected is " + (if Bullish_Bearish == Bullish_Bearish."Bullish" then "'Bullish'"
  else if Bullish_Bearish == Bullish_Bearish."Bearish" then "'Bearish'"
  else if Bullish_Bearish == Bullish_Bearish."Both" then "'Both'"
  else ""), Color.WHITE);
=== of code ###
C-AN ICHIMOKU CHART EVALUATION SETUP
In the ThinkScript Lounge there was a request to post the setup used when evaluating an Ichomoku chart. Below is a picture of the setup. Each non-builtin indicator will be listed in this Snippet Collection.
-
Ichi_Signals…… Page 147
-
LinearRegCh100 ………. is a built-in
-
MACD_via_Hull_MA_fav………. See below
-
Ichi_TK_Exit_Warning ……… Page 139
-
IchiOneGlance ………. Page 143
-
DMI_Oscillator_SFL_Fav ………. Page 158
-
PolarizedFractalEfficiency_SFL ………. Page 160
-
Three_X_Oscillator ………. Page 161
C-MACD BASED ON HULL MOVING AVERAGE
Comment: Using the Hull moving average in the MACD in lieu of the SMA or EMA produces a more sensitive/responsive MACD and is included here for that reason.
#MACD based on Hull Moving Average W/peak/ebb arrows
#TOS title = MACD_via_Hull_MA_fav

declare lower;

input fastLength = 12;
input slowLength = 26;
input MACDLength = 9;
input AverageType = {SMA, EMA, default HULL};

plot Value;
plot Avg;
switch (AverageType) {
  case SMA:
    Value = Average(close, fastLength) - Average(close, slowLength);
    Avg = Average(Value, MACDLength);
  case EMA:
    Value = ExpAverage(close, fastLength) - ExpAverage(close, slowLength);
    Avg = ExpAverage(Value, MACDLength);
  case HULL:
    Value =  MovingAverage(AverageType.HULL, close, fastLength) -  MovingAverage(AverageType.HULL, close, slowLength);
    Avg = Average(Value, MACDLength);
}

plot Diff = Value - Avg;
plot ZeroLine = 0;
Value.SetDefaultColor(GetColor(1));
Avg.SetDefaultColor(GetColor(8));
Diff.SetDefaultColor(GetColor(5));
Diff.SetPaintingStrategy(PaintingStrategy.HISTOGRAM);
Diff.SetLineWeight(3);
Diff.DefineColor("Positive and Up", Color.GREEN);
Diff.DefineColor("Positive and Down", Color.DARK_GREEN);
Diff.DefineColor("Negative and Down", Color.RED);
Diff.DefineColor("Negative and Up", Color.DARK_RED);
Diff.AssignValueColor(if Diff >= 0 then if Diff > Diff[1] then Diff.color("Positive and Up") else Diff.color("Positive and Down") else if Diff < Diff[1] then Diff.color("Negative and Down") else Diff.color("Negative and Up"));
ZeroLine.SetDefaultColor(GetColor(0));

#*********plot Min arrows**********
def MinArrow = if (Value < Value[1] and value[1] < Value[2] and value[2] < Value[3] and value[-1] > Value and value < 0)
  then 0
  else if (Value > Value[1])
  then double.nan
  else double.nan;

plot UpArrow = if(MinArrow == 0, value, double.nan);
UpArrow.AssignValueColor(Color.Green);
UpArrow.SetPaintingStrategy(PaintingStrategy.ARROW_UP);
UpArrow.SetLineWeight(1);
UpArrow.HideBubble();

#*********plot Max arrows**********
def MaxArrow = if (Value > Value[1] and value[1] > Value[2] and value[2] > Value[3] and value[-1] < Value and value > 0)
  then 0
  else if (Value > Value[1])
  then double.nan
  else double.nan;

plot DwnArrow = if(MaxArrow == 0, value, double.nan);
DwnArrow.AssignValueColor(Color.cyan);
DwnArrow.SetPaintingStrategy(PaintingStrategy.ARROW_Down);
DwnArrow.SetLineWeight(1);
DwnArrow.HideBubble();

#*********plot Max signal(Avg) arrows**********
def SignalArrow = if (Avg > Avg[1] and Avg[1] > Avg[2] and Avg[2] > Avg[3] and Avg[-1] < Avg and Avg > 0)
  then 0
  else if (Avg > Avg[1])
  then double.nan
  else double.nan;

plot downSignalArrow = if(SignalArrow == 0, avg, double.nan);
downSignalArrow.AssignValueColor(Color.yellow);
downSignalArrow.SetPaintingStrategy(PaintingStrategy.ARROW_Down);
downSignalArrow.SetLineWeight(1);
downSignalArrow.HideBubble();

AddCloud(ZeroLine, Value, color.RED, color.GREEN);
C- DMI_OSCILLATOR_SFL_FAV
#hint:The popular builtin <b>DMI_Oscillator with arrows and lines</b> in positive and negative levels based on inputs. Use the lines and arrows to define your criteria/decision points.

declare lower;
input length = 10;#hint length:The number of bars with which the DI+ and DI- components are calculated.
#input paintBars = yes;#hint paintBars:Defines whether or not to color price plot according to respective oscillator values (red for negative, green for positive).
input PlotADX = yes;#hint PlotADX:Toggles plot the ADX line
input ShowArrowsLines = YES;#hint ShowArrowsLines:Toggles all arrows and above/below zero lines
input CrossAboveValue = 10;#hint CrossAboveValue:Defines the above-zero-value at which an arrow is plotted.
input CrossBelowValue = 5;#hint CrossBelowValue:Defines the below-zero-value at which an arrow is plotted.

plot WhiteLabel = Double.NaN;
WhiteLabel.SetDefaultColor(Color.White);

def na = Double.NaN;
def diPlus = DMI(length)."DI+";
def diMinus = DMI(length)."DI-";
def DX = if (diPlus + diMinus > 0) then 100 * AbsValue(diPlus - diMinus) / (diPlus + diMinus) else 0;

plot ADX = if PlotADX then  WildersAverage(DX, length) else Double.NaN;
ADX.AssignValueColor(if (diPlus > diMinus) then Color.UPTICK else Color.DOWNTICK);
ADX.SetPaintingStrategy(PaintingStrategy.LINE);
ADX.SetLineWeight(2);

AddLabel(PlotADX, "Current ADX(" + length + ") value = " + Round(ADX, 1), ADX.TakeValueColor());

plot Osc = diPlus - diMinus;
plot Hist = Osc;
Osc.SetDefaultColor(Color.WHITE);
Osc.SetLineWeight(2);
Hist.SetPaintingStrategy(PaintingStrategy.HISTOGRAM);
Hist.SetLineWeight(3);
Hist.DefineColor("Positive", Color.UPTICK);
Hist.DefineColor("Negative", Color.DOWNTICK);
Hist.AssignValueColor(if Hist > 0 then Hist.Color("Positive") else Hist.Color("Negative"));
Hist.HideTitle();

plot ZeroLine = 0;
ZeroLine.SetDefaultColor(Color.YELLOW);
#plot line_5above = 5;
#line_5above.SetDefaultColor(Color.YELLOW);
plot line_10above = if ShowArrowsLines then  CrossAboveValue else double.nan;
line_10above.SetDefaultColor(Color.YELLOW);
#plot line_5below = -5;
#line_5below.SetDefaultColor(Color.YELLOW);
plot line_10below = if ShowArrowsLines then  - CrossBelowValue else Double.nan;
line_10below.SetDefaultColor(Color.YELLOW);
ZeroLine.SetDefaultColor(Color.GRAY);
DefineGlobalColor("Positive", Color.UPTICK);
DefineGlobalColor("Negative", Color.DOWNTICK);

#AssignPriceColor(if yes
#    then Color.CURRENT
#    else if Osc > 0
#        then GlobalColor("Positive")
#        else GlobalColor("Negative"));
#======== Above-zero arrow plots when crossing input values ==========
def Upper_Up_Cross = if ShowArrowsLines && Osc crosses above CrossAboveValue then 1 else 0;

plot D_Up_Cross = if ShowArrowsLines&&  Upper_Up_Cross then Osc else Double.NaN;
D_Up_Cross.SetPaintingStrategy(PaintingStrategy.ARROW_DOWN);
D_Up_Cross.SetLineWeight(1);
D_Up_Cross.SetDefaultColor(Color.GREEN);

AddLabel(ShowArrowsLines, "Above-zero arrow value = " + CrossAboveValue, Color.GREEN);

def Upper_Dwn_Cross = if ShowArrowsLines && Osc crosses below CrossAboveValue then 1 else 0;
plot D_Upper_Dwn_Cross = if Upper_Dwn_Cross then Osc else Double.NaN;
D_Upper_Dwn_Cross.SetPaintingStrategy(PaintingStrategy.ARROW_DOWN);
D_Upper_Dwn_Cross.SetLineWeight(1);
D_Upper_Dwn_Cross.SetDefaultColor(Color.DARK_GREEN);
#AddLabel(ShowArrowsLines,"Above-zero arrow value = " + CrossAboveValue, color.DARK_GREEN);

#======== Below-zero arrow plots when crossing input values ==========
def Down_Cross = if ShowArrowsLines && Osc crosses below -CrossBelowValue then 1 else 0;

plot D_Down_Cross = if Down_Cross then -CrossBelowValue else Double.NaN;
D_Down_Cross.SetPaintingStrategy(PaintingStrategy.ARROW_UP);
D_Down_Cross.SetLineWeight(1);
D_Down_Cross.SetDefaultColor(Color.RED);

AddLabel(ShowArrowsLines, "Below-zero arrow value = minus " + (CrossBelowValue), Color.RED);

def Lower_MinOSC = if Osc < (-CrossBelowValue) && Osc < Osc[1] && Osc < Osc[-1] then 1 else 0;

plot D_Lower_MinOSC = if ShowArrowsLines && Lower_MinOSC then Osc else Double.NaN;
D_Lower_MinOSC.SetPaintingStrategy(PaintingStrategy.ARROW_UP);
D_Lower_MinOSC.SetLineWeight(1);
D_Lower_MinOSC.SetDefaultColor(Color.DARK_RED);
#AddLabel(1,"Below-zero arrow value = minus " + (CrossBelowValue), color.RED);
C- PolarizedFractalEfficiency_SFL
#TOS Title = PolarizedFractalEfficiency_SFL
declare lower;

input length = 10;
input smoothingLength = 5;

def diff = close - close[length - 1];
def val = 100 * Sqrt(Sqr(diff) + Sqr(length)) / sum(Sqrt(1 + Sqr(close - close[1])), length - 1);

plot PFE = ExpAverage(if diff > 0 then val else -val, smoothingLength);
PFE.SetDefaultColor(GetColor(8));

plot UpperLevel = 50;
UpperLevel.SetPaintingStrategy(PaintingStrategy.LINE);
UpperLevel.SetStyle(Curve.SHORT_DASH);
UpperLevel.SetLineWeight(1);
UpperLevel.SetDefaultColor(Color.YELLOW);

plot Upper100Level = 100;
Upper100Level.SetPaintingStrategy(PaintingStrategy.LINE);
Upper100Level.SetStyle(Curve.SHORT_DASH);
Upper100Level.SetLineWeight(1);
Upper100Level.SetDefaultColor(Color.YELLOW);

plot Lower100Level = -100;
Lower100Level.SetPaintingStrategy(PaintingStrategy.LINE);
Lower100Level.SetStyle(Curve.SHORT_DASH);
Lower100Level.SetLineWeight(1);
Lower100Level.SetDefaultColor(Color.YELLOW);

plot ZeroLine = 0;
ZeroLine.SetDefaultColor(GetColor(5));
ZeroLine.SetPaintingStrategy(PaintingStrategy.LINE);
ZeroLine.SetStyle(Curve.LONG_DASH);
ZeroLine.SetLineWeight(2);
ZeroLine.SetDefaultColor(Color.YELLOW);

plot LowerLevel = -50;
AddCloud(PFE,ZeroLine,color.GREEN,color.RED);
LowerLevel.SetDefaultColor(GetColor(5));
LowerLevel.SetPaintingStrategy(PaintingStrategy.LINE);
LowerLevel.SetStyle(Curve.SHORT_DASH);
LowerLevel.SetLineWeight(1);
LowerLevel.SetDefaultColor(Color.YELLOW);

AddLabel(1,"Green Cloud = Bullish",Color.GREEN);
AddLabel(1,"Red Cloud = Bearish",Color.RED);
C- Three_X_Oscillator
#hint:<b>Three X Stochastic Oscillator</b>
# Title = Three_X_Oscillator
# Richard Houser created this 3X Oscillator code on the Yahoo ThinkScript forum
# Stochastic calculated using Lane's formulas in favor over TOS' (has issues)

declare lower;
input Use_OB_OS = yes;#hint Use_OB_OS:<b>Show OverBought/OverSold lines.</b>\n Is alternate to using HH/LL lines.
input Use_HH_LL = no;#hint Use_HH_LL:<b>Show Highest/Lowest actual value lines.</b>\n Is alternate to using OB/OS lines.
input show40_60 = no;#hint show40_60:Yes shows the 40 & 60 lines
input K_period = 21;
input D_period = 9;
input SlowTrendLength = 3;
input smoothing_type = { default EMA, SMA };
input stochastic_type = { FAST, default SLOW };
input over_bought = 80;#hint over_bought:This can be replaced by the  line of the highest actual value
input over_sold = 20;#hint over_sold:This can replaced by the line of the lowest actual value

Plot OB = If Use_OB_OS then over_bought else double.nan;
OB.SetLineWeight(1);
OB.SetDefaultColor(Color.yellow);

Plot OS = If Use_OB_OS then over_sold else double.nan;
OS.SetLineWeight(1);
OS.SetDefaultColor(Color.yellow);

plot Mid = 50;
mid.SetStyle(Curve.LONG_DASH);
mid.SetLineWeight(2);
mid.SetDefaultColor(Color.pink);

plot Mid_h = If  show40_60 then 60 else Double.nan ;
Mid_h.SetStyle(Curve.SHORT_DASH);
Mid_h.SetLineWeight(1);
Mid_h .SetDefaultColor(Color.pink);
Mid_H.Hidebubble();

plot Mid_L = If  show40_60 then 40 else Double.nan ;
Mid_L.SetStyle(Curve.SHORT_DASH);
Mid_L.SetLineWeight(1);
Mid_L.SetDefaultColor(Color.pink);
Mid_L.Hidebubble();

def aggPer = GetAggregationPeriod();

def adjAggPer = if aggPer == AggregationPeriod.MIN then
  AggregationPeriod.THREE_MIN
  else if aggPer == AggregationPeriod.TWO_MIN then
  AggregationPeriod.FIVE_MIN
  else if aggPer == AggregationPeriod.THREE_MIN then
  AggregationPeriod.TEN_MIN
  else if aggPer == AggregationPeriod.FOUR_MIN then
  AggregationPeriod.TEN_MIN
  else if aggPer == AggregationPeriod.FIVE_MIN then
  AggregationPeriod.FIFTEEN_MIN
  else if aggPer == AggregationPeriod.TEN_MIN then
  AggregationPeriod.THIRTY_MIN
  else if aggPer == AggregationPeriod.FIFTEEN_MIN then
  AggregationPeriod.HOUR
  else if aggPer == AggregationPeriod.TWENTY_MIN then
  AggregationPeriod.HOUR
  else if aggPer == AggregationPeriod.THIRTY_MIN then
  AggregationPeriod.TWO_HOURS
  else if aggPer == AggregationPeriod.HOUR then
  AggregationPeriod.FOUR_HOURS
  else if aggPer == AggregationPeriod.TWO_HOURS then
  AggregationPeriod.DAY
  else if aggPer == AggregationPeriod.FOUR_HOURS then
  AggregationPeriod.DAY
  else if aggPer == AggregationPeriod.DAY then
  AggregationPeriod.THREE_DAYS
  else if aggPer == AggregationPeriod.TWO_DAYS then
  AggregationPeriod.WEEK
  else if aggPer == AggregationPeriod.THREE_DAYS then
  AggregationPeriod.WEEK
  else if aggPer == AggregationPeriod.FOUR_DAYS then
  AggregationPeriod.MONTH
  else if aggPer == AggregationPeriod.WEEK then
  AggregationPeriod.MONTH
  else if aggPer == AggregationPeriod.MONTH then
  AggregationPeriod.MONTH
  else
  Double.NaN;

def _kPeriod;
def _dPeriod;
def _slowTrendLength;

if aggPer == AggregationPeriod.MONTH
then {
  _kPeriod = K_period * 3;
  _dPeriod = D_period * 3;
  _slowTrendLength = SlowTrendLength * 3;
} else {
  _kPeriod = K_period;
  _dPeriod = D_period;
  _slowTrendLength = SlowTrendLength;
}

def priceH = high( period = adjAggPer );
def priceL = low( period = adjAggPer );
def priceC = close( period = adjAggPer );
def lowest_low = Lowest( low, _kPeriod );
def highest_high = Highest( high, _kPeriod );
def fastK = if ( highest_high - lowest_low ) <= 0 then 0 else 100 * ( close - lowest_low ) / ( highest_high - lowest_low );
def fastD = if smoothing_type == smoothing_type.EMA then ExpAverage( fastK, _dPeriod ) else Average( fastK, _dPeriod );
def slowK = fastD;
def slowD = if smoothing_type == smoothing_type.EMA then ExpAverage( slowK, _dPeriod ) else Average( slowK, _dPeriod );

#---Stochastic
plot stochD = if stochastic_type == stochastic_type.FAST then fastD else slowD;
stochD.SetPaintingStrategy( PaintingStrategy.POINTS );
stochD.HideBubble();
stochD.AssignValueColor( if stochD >= stochD[1] then Color.GREEN else if stochD < stochD[1] then Color.RED else Color.GRAY );

##################################################
# Script below will plot a horizontal line at the lowest 3x Osc levelfor all of the data loaded to the chart
plot stochlowest = If Use_HH_LL then LowestAll(stochD) else double.nan;
stochlowest.SetPaintingStrategy(PaintingStrategy.LINE);
stochlowest.SetStyle(Curve.SHORT_DASH);
stochlowest.SetDefaultColor(Color.red);
stochlowest.SetLineWeight(2);
stochlowest.HideBubble();
stochlowest.HideTitle();

#####
#Script below will plot a horizontal line at the highest 3x Osc level for all of the data loaded to the chart
plot stochhighest = If Use_HH_LL then HighestAll(stochD) else double.nan;
stochhighest.SetPaintingStrategy(PaintingStrategy.LINE);
stochhighest.SetStyle(Curve.SHORT_DASH);
stochhighest.SetLineWeight(2);
stochhighest.SetDefaultColor(Color.green);
stochhighest.HideBubble();
stochhighest.HideTitle();

AddLabel(Use_HH_LL,"Highest value " + HighestAll(round(stochD,2)) + " Bars Ago = " + AsText(stochhighest, NumberFormat.TWO_DECIMAL_PLACES), Color.GREEN);
AddLabel(Use_HH_LL, "Lowest value " + LowestAll(round(stochD,2)) + " Bars Ago = " + AsText(stochlowest, NumberFormat.TWO_DECIMAL_PLACES), Color.RED);
C-ONEGLANCE STUDY
#OneGlance by StanL Version 2.1 dated 7/19/14
#Hint:The 'OneGlance' study evaluates 13 criteria in a bullish(green)/bearish(red) dashboard presentation. All study parameters and the bullish-bearish-triggers may be set via inputs.
# OVERVIEW: 'OneGlance' is by StanL 4/30/14. Emphasis has been put on clarity and flexibility: clarity via bubbles and labels; flexibility via input-setable parameters and triggers to match your trading style. The info bubbles in rdite studies often state the default values buil into TOS' studies.
# USAGE: 'OneGlance' uses up a lot of a chart's real estate and is much more readable when not squeezed; perhaps as an only lower study. One viewing option, when comparing a 'OneGlance' item to a corresponding full TOS chart, is to turn off the price data in 'chart Settings'. Depending on your vision quality and space availability, you may find a magnifier usage useful (google Magnifixer freeware).
#Usage re Righthand(RH) bubbles. These bubble can be made to expand into empty unused space to look good. To get the RH space select the PAN(upper-finger-pointer) in drawing tools and drag the chart to the left. Also see 'T-CHANGING RIGHT EXPANSION AREA SETTING'.
# POINT-OF-VIEW: 'OneGlance' is oriented (parameters and triggers) towards defining the bullish aspects of the studies used. Realize that if a study is not bullish, then it is not necessarily bearish. If you are bearish oriented, i.e. looking for short-opportunities, the modifying of parameters and triggers can enhance you bearish orientation.
# FUTURE: Although 'OneGlance' already uses a lot of real estate, there is no limit to additional studies being added except for space. Also, depending on your coding skills, certain user-preferred studies may be extracted to form a more-specific abridged 'OneGlance' utilizing less chart real estate and just the studies that you are most interested in.
#INPUTS: Because of the multitude of studies, the input list in 'Edit Studies' is long but components have been titled to make them self explanatory and with info-bubbles to further identify TOS default values.
#Ver 2.1 Added right-hand bubbles. Corrected label error. Added toggle for left-hand bubbles Added usage note on how to pan the chart to get RH space and bubble clarity.

declare lower;

plot WhiteLabel = Double.NaN;
WhiteLabel.SetDefaultColor(Color.White);

input showlabels = yes;#hint showlabels:Toggles labels on/off.
input LH_Bubbles = yes;#hint LH_Bubbles:Toggles left hand bubbles ON/OFF.\nThese bubbles show the study's conditions including the triggers for chart indications (Bull/Bear).

def c = close;
def h = high;
def l = low;
def o = open;

#Define variables used to place a bubble
#========================================
#Input Offset = BarNumber() / 2;
def barNum = BarNumber();
def offset = 0;
def LastBar = !IsNaN(open) and IsNaN(open [-1] ) ;
def BubbleLocation = LastBar[offset];#Use this to locate the ending bar location
def FirstBar = if barNum == 1 then 1 else 0;
def FirstBarValue = if barNum == 1 then 1 else 0;
def LastBarValue = if LastBar && barNum == barnumber() then barNum else 0;
def MidBar = if LastBar then barNum == (BarNumber() / 2)  else 0;
Def TotalBars = HighestAll(barNumber());
#AddLabel( yes, concat( TotalBars, " = Total bars" + " and bar count = " + barnumber()), Color.white);
#example
#addchartbubble(LastBar,45, "This is a last bar bubble", color.White);

#==========================================
#Polarized Fractal Efficiency
#===========================
input PFE_length = 10;#hint PFE_length:The length used in calculating the Polarized Fractal Efficiency. TOS default is 10.
input PFE_smoothingLength = 5;#hint PFE_smoothingLength:TOS default is 5.
input PFE_trig = 50;#hint PFE_trig:The value that triggers the PFE from Bullish to bearish.

def diffpfe = c - c[PFE_length - 1];
def val = 100 * Sqrt(Sqr(diffpfe) + Sqr(PFE_length)) / Sum(Sqrt(1 + Sqr(c - c[1])), PFE_length - 1);
def PFE = ExpAverage(if diffpfe > 0 then val else -val, PFE_smoothingLength);

plot PFE_Line = if IsNaN(close) then Double.NaN else 17.5;
PFE_Line.SetPaintingStrategy(PaintingStrategy.LINE_VS_SQUARES);
PFE_Line.SetLineWeight(5);
PFE_Line.AssignValueColor(if PFE > PFE_trig then Color.UPTICK else Color.DOWNTICK);
PFE_Line.HideBubble();
#== end of PFE ==

#MomentumPercent
#=================
input MOM_Pct_trig = 0.00;#Hint MOM_Pct_trig:The percent value that toggles the chart between green and red. Normal is 0.00 %.
input MomPctLength = 5;#Hint MomPctLength:The offset length (bars back) that the current bar is compared to calculate this Momentum Percent. TOS default is 10.

def mom_pct = MomentumPercent(length = MomPctLength)."Momentum, %" - 100;

plot MomPct_Line = if IsNaN(close) then Double.NaN else 21;
MomPct_Line.SetPaintingStrategy(PaintingStrategy.LINE_VS_SQUARES);
MomPct_Line.SetLineWeight(5);
MomPct_Line.AssignValueColor(if mom_pct >= MOM_Pct_trig then Color.UPTICK else Color.DOWNTICK);
MomPct_Line.HideBubble();
#=== end ====

#Ichimoku Study
#==============
#NOTES: One major bullish indication in this study is when the Tenkan excaads the Kijun. Their default lengths of 26 and 9 may be shortened to increase response sensitivity. There are other bullish Ichimoku indicators.

input tenkan_period = 9;#hint tenkan_period:The agg-bars used to calculate the tenkan value. TOS' default is 9.
input kijun_period = 26;#hint kijun_period:The agg-bars used to calculate the kijun value. TOs' default is 26.

def Ichi_Tenkan = Ichimoku(tenkan_period,kijun_period)."Tenkan" ;

plot Ichi_Line = if IsNaN(close) then Double.NaN else 24.5;
Ichi_Line.SetPaintingStrategy(PaintingStrategy.LINE_VS_SQUARES);
Ichi_Line.SetLineWeight(5);
Ichi_Line.AssignValueColor(if Ichimoku(tenkan_period,kijun_period)."Tenkan" >
Ichimoku(tenkan_period,kijun_period)."Kijun" then Color.UPTICK else Color.DOWNTICK);
Ichi_Line.HideBubble();
#=== end ===

#===== RSI ======
input RSI_length = 14;#hint RSI_length:The number of bars used in the calculation. TOS' default value is 14. Shorten for a faster response.
input RSI_OB = 70;#hint RSI_OB:The RSI overbought value. TOS' default is 70.
input RSI_OS = 30;#hint RSI_OS:The RSI oversold value. TOS' default = 30.
#input price = close;
input RSILowTrig = 50;#hint RSILowTrig:The trigger is between this 'RSILowTrig' value and 100 and is rising for the last 'rsi_UpBars' bars.
input rsi_UpBars = 3;#hint rsi_UpBars: The number of consecutive rising bars used to evaluated the trigger. Note that using 0 can expose you to a RSI that is falling down from the OverBought line.

def rsi_here = RSIWilder(RSI_length, RSI_OB, RSI_OS, c)."RSI";
def RSI_trig = if (Between(rsi_here, RSILowTrig, 100) && Sum(rsi_here < rsi_here[1], rsi_UpBars) == rsi_UpBars) then 1 else 0;
#def HullMA = HullMovingAvg(Price = Hull_price, length = Hull_length, displace = Hull_displace).HMA;

plot rsi_Line = if IsNaN(close) then Double.NaN else 28;
rsi_Line.SetPaintingStrategy(PaintingStrategy.LINE_VS_SQUARES);
rsi_Line.SetLineWeight(5);
#def HullMA = HullMovingAvg(Price = Hull_price, length = Hull_length, displace = Hull_displace).HMA;
rsi_Line.AssignValueColor(if RSI_trig then Color.UPTICK else Color.DOWNTICK);
rsi_Line.HideBubble();
#== end ==

#Bollinger Bands MOBO(MOmentum BreakOut)
#============================================
#Explanation of how this works.  +/- 0.8 std deviation Bollinger Bands are the criteris for bullish/bearish plots. When the close rises above the upper band the signal is bullish and stays bullish until the close moves below the lower band when the plot turns to bearish and remains bearish until the close rises above the upper band.
input MOBO_length = 10;#hint MOBO_length:The agg-bars used in the standard deviation(SD) calculation to define the upper and lower bands.
input Num_Dev_Dn = -0.8;#hint Num_Dev_Dn:The SD of the lower band. Similar to the 2,0 SD used in the Bollinger Bands
input Num_Dev_up =  0.8;#hint Num_Dev_up:The SD of the upper band. Similar to the 2,0 SD used in the Bollinger Bands

def sDev = StDev(data = c, length = MOBO_length);
def Midmobo = Average(c, length = MOBO_length);
def Lowermobo = Midmobo + Num_Dev_Dn * sDev;
def Uppermobo = Midmobo + Num_Dev_up * sDev;
def upmobo = if upmobo[1] == 0 and c >= Uppermobo then 1 else if upmobo[1] == 1 and c > Lowermobo then 1 else 0;
def upmo = if upmobo  and c > Uppermobo then 1 else 0;
def dnmo = if !upmobo and c > Lowermobo then 1 else 0;

plot MOBO_Line = if IsNaN(close) then Double.NaN else 31.5;
MOBO_Line.SetPaintingStrategy(PaintingStrategy.LINE_VS_SQUARES);
MOBO_Line.SetLineWeight(5);
MOBO_Line.AssignValueColor(if upmobo == 1 then Color.UPTICK else Color.DOWNTICK);
MOBO_Line.HideBubble();
#=== end ===

#==== Squeeze by Mobius @ My Trade =====
def nK            = 1.5;
def nBB           = 2.0;
def lengthsqueeze = 20;
def BBHalfWidth = StDev(c, lengthsqueeze);
def KCHalfWidth = nK * AvgTrueRange(h, c, l, lengthsqueeze);
def isSqueezed  =  nBB * BBHalfWidth / KCHalfWidth < 1;

plot BBS_Ind = if IsNaN(close) then Double.NaN else 50;
BBS_Ind.AssignValueColor(if isSqueezed then Color.RED else Color.WHITE);
BBS_Ind.SetPaintingStrategy(PaintingStrategy.POINTS);
BBS_Ind.SetLineWeight(3);
BBS_Ind.HideBubble();
#=== end ===

#== Line Spacer ===

plot line55 = if IsNaN(close) then Double.NaN else 55;#Used to manage space to set labels above this value.
line55.SetDefaultColor(Color.BLUE);#Insert color to match your background to make line invisible
line55.HideBubble();
#== end ==

#==== DMI_Oscillator ====
input DMIO_Length = 10;#hint DMIO_Length:The agg-bars used to calculate the DMI_Oscillator. TOS' default is 10.
input DMIO_trig = 0;#hint DMIO_trig:The trigger value that toggles bullish/bearish. Low values risk a turn down to below 0. Persistent values above 10-15 would be considered a moderate/strong bullish indication.

def DMI_OSC_here = reference DMI_Oscillator(length = DMIO_Length).Osc;

plot DMIO_Line = if IsNaN(close) then Double.NaN else 14;
DMIO_Line.SetPaintingStrategy(PaintingStrategy.LINE_VS_SQUARES);
DMIO_Line.SetLineWeight(5);
DMIO_Line.AssignValueColor(if DMI_OSC_here > DMIO_trig then Color.UPTICK else Color.DOWNTICK);
DMIO_Line.HideBubble();
#=== end ===

#==== ADX Indicator ====
input ADX_Length = 10;#hint ADX_Length: Length used in the ADX calculation of the trigger ADX. TOS' default is 14. You may want to use 10 to be consistent with the DMI_Oscillator.
input ADX_trig = 15;#hint ADX_trig:The bullish ADX value that toggles the bull/bear chart display. You may use any value of a bullish ADX to suit your preference. A strong ADX is >= 25 especially if it persists.

def ADX_here = Round(reference ADX(length = ADX_Length), 1);
def DMI_Pos = if DMI(ADX_Length)."DI+" > DMI(ADX_Length)."DI-" then 1 else 0;# DMI+ > DMI-

plot ADX_Line = if IsNaN(close) then Double.NaN else 10.5;
ADX_Line.SetPaintingStrategy(PaintingStrategy.LINE_VS_SQUARES);
ADX_Line.SetLineWeight(5);
ADX_Line.AssignValueColor(if DMI_Pos && ADX_here >= ADX_trig then Color.UPTICK else Color.DOWNTICK);
ADX_Line.HideBubble();
#== end ==

#TrueStrengthIndex
#===================
input TSI_trig = 0 ;#hint TSI_trig:The value that toggles bull/bear. TSI has a 'TSI(value)' and a 'signal' line with a zero line. This deals with the 'TSI(value)' being above the zero line. An earlier trigger could be had by analysis as was done with the MACD herein.
def TSI_here = reference TrueStrengthIndex(25, 13, 8, "WMA").TSI;

plot TSI_Line = if IsNaN(close) then Double.NaN else 7;
TSI_Line.SetPaintingStrategy(PaintingStrategy.LINE_VS_SQUARES);
TSI_Line.SetLineWeight(5);
TSI_Line.AssignValueColor(if TSI_here > TSI_trig then Color.UPTICK else Color.DOWNTICK);
TSI_Line.HideBubble();

#Dynamic Momentum Index
#=======================
#Note: This is similar to the RSI but is more sensitive/responsive
input DYMI_length = 14;#hint DYMI_length:The length usd for this calculation. TOS default is 14.
input DYMI_trig = 70;#hint DYMI_trig:The trigger value used to toggle the Bullish/bearish indication.

def DYMI_here = DynamicMomentumIndex(DYMILength = DYMI_length).DYMI;

plot DYMI_Line = if IsNaN(close) then Double.NaN else 3.5;
DYMI_Line.SetPaintingStrategy(PaintingStrategy.LINE_VS_SQUARES);
DYMI_Line.SetLineWeight(5);
DYMI_Line.AssignValueColor(if DYMI_here >= DYMI_trig then Color.UPTICK else Color.DOWNTICK);
DYMI_Line.HideBubble();
#== end ====

#====== MACD =======
#========= Note about the two MACD  indicators below =======
# HOTES: People use the MACD for decision making in two ways. The first below is when the MACD line crosses above the signal line. This is also when the MACD histogram goes above zero. This method gives early indications.
#The second frequent use of the MACD is when the MACD itself (value) crosses aboce the zero line. This is a less risky use of the MACD but may sacrifice early entry and related profits.
#==== end of notes ========

#====== MACD.value is above MACD.avg (signal line)======
input fastLength_1 = 12;#hint fastLength_1:For the MACD plot that evaluates the MACD.Value being above the MACD.Avg (signal line).
input slowLength_1 = 26;#hint slowLength_1:For the MACD plot that evaluates the MACD.Value being above the MACD.Avg (signal line).
input MACDLength_1 = 9;#hint MACDLength_1:For the MACD plot that evaluates the MACD.Value being above the MACD.Avg (signal line).
input AverageType_1 = {SMA, default EMA};#hint AverageType_1:For the MACD plot that evaluates the MACD.Value being above the MACD.Avg (signal line).

def macd_Val_1 = MACD(fastLength_1, slowLength_1, MACDLength_1, AverageType_1).Value;
def macd_Avg1 = MACD(fastLength_1, slowLength_1, MACDLength_1, AverageType_1).Avg;
def MACD_trig = if macd_Val_1 > macd_Avg1 then 1 else 0;
#def MACD_Value = MACD(MACDLength = MACDLength, AverageType = "EMA").Diff;

plot Macd_Line1 = if IsNaN(close) then Double.NaN else 35;
Macd_Line1.SetPaintingStrategy(PaintingStrategy.LINE_VS_SQUARES);
Macd_Line1.SetLineWeight(5);
Macd_Line1.AssignValueColor(if macd_Val_1 > macd_Avg1 then Color.UPTICK else Color.DOWNTICK);
Macd_Line1.HideBubble();
#== end ====

#==== MACD value is above zero ====
#NOTE that the fast and slow length may been shortened for faster response. These inputs have a '_2' after the standard MACD parameters to distinguish them from the MACD.
input fastLength_2 = 12;#hint fastLength_2:For the MACD plot that evaluates the MACD.Value being above the zero line. The value may be altered for faster response.
input slowLength_2 = 26;#hint slowLength_2:For the MACD plot that evaluates the MACD.Value being above the zero line. The value may be altered for faster response.
input MACDLength_2 = 9;#hint MACDLength_2:For the MACD plot that evaluates the MACD.Value being above the zero line. The value may be altered for faster response.
input AverageType_2 = {SMA, default EMA};#hint AverageType_2:For the MACD plot that evaluates the MACD.Value being above the zero line. The value may be altered for faster/slower response. This selects tha average type to be used.
input macdVal_trig = 0;#hint macdVal_trig:For the MACD plot that evaluates the MACD value being above the zero line. The normal default value is 0, i.e. the zero line, but may be altered here.

def MACDValue_2 = MACD(fastLength_2, slowLength_2, MACDLength_2, AverageType_2).Value;

ot MACD_Line2 = if IsNaN(close) then Double.NaN else 38.5;
CD_Line2.SetPaintingStrategy(PaintingStrategy.LINE_VS_SQUARES);
CD_Line2.SetLineWeight(5);
CD_Line2.AssignValueColor(if MACDValue_2 >= macdVal_trig then Color.UPTICK else Color.DOWNTICK);
CD_Line2.HideBubble();
= end ==

#======= HullMovingAvg ==========
input Hull_price = close;#hint Hull_price:The price basis of the HMA.
input Hull_length = 20;#hint Hull_length:The agg-bars used in the HMA calculation.
input Hull_displace = 0;#hint Hull_displace:Displacement of the HMA in agg-bars

def HullMA = HullMovingAvg(Price = Hull_price, length = Hull_length, displace = Hull_displace).HMA;

plot Hull_Line = if IsNaN(close) then Double.NaN else 42;
Hull_Line.SetPaintingStrategy(PaintingStrategy.LINE_VS_SQUARES);
Hull_Line.SetLineWeight(5);
Hull_Line.AssignValueColor(If HullMA > HullMA[1] then Color.UPTICK
else Color.DOWNTICK);
Hull_Line.HideBubble();
#
#Hull_Line.AssignValueColor(If HullMA > HullMA[-1] then color.BLUE else color.WHITE);
#== end ==

#======== Bubbles ==============
AddChartBubble(FirstBar && LH_Bubbles, 42, "HullMovingAvg(" + Hull_length + "). " + "Trigger = bullish when HullMovingAvg > previous HullMovingAvg.", Color.WHITE);
AddChartBubble(BubbleLocation, 42, "HullMovingAvg" ,Color.WHITE);

#=====
AddChartBubble(FirstBar && LH_Bubbles, 35, "MACD(" + fastLength_1 + "," +  slowLength_1 + "," + MACDLength_1 + "," +
AverageType_1 + "). Bullish when MACD.Value is above MACD.Avg (signal line). Trigger = MACD().value > MACD().avg",
Color.PINK);
AddChartBubble(BubbleLocation, 35, " MACD > signal line" , Color.PINK);

#======
AddChartBubble(FirstBar && LH_Bubbles, 38.5, "MACD.Value(" + fastLength_2 + "," + slowLength_2 + "," + MACDLength_2 + "," + AverageType_2 + ")" + "Bullish when MACD.Value is above the zero line. Trigger = " + macdVal_trig + "(Normally the zero line)", Color.PINK);
AddChartBubble(BubbleLocation, 38.5, "MACD > 0" , Color.PINK);

#=======
AddChartBubble(FirstBar && LH_Bubbles, 17.5 , "Polarized Fractal Efficiency (" + PFE_length + "). " + "Trend UP = 0 to 100. Trigger = " + PFE_trig, Color.WHITE);
AddChartBubble(BubbleLocation, 17.5 , "Polarized Fractal Efficiency" , Color.WHITE);

#==========
AddChartBubble(FirstBar && LH_Bubbles, 21, "MomentumPercent(" + MomPctLength + "). Bullish when > 0 % & for long periods. Trigger = " + MOM_Pct_trig + " percent", Color.CYAN);
AddChartBubble(BubbleLocation, 21, "Momentum Pct", Color.CYAN);

#========
AddChartBubble(FirstBar && LH_Bubbles, 24.5, "Ichimoku(" + tenkan_period + ", " + kijun_period + "). Bullish trigger = when tenkan > kijun. The more the diff, the stronger the trend.", Color.WHITE);
AddChartBubble(BubbleLocation, 24.5, "Ichimoku" , Color.WHITE);

#======
AddChartBubble(FirstBar && LH_Bubbles, 28, "RSI" + RSI_length + ")." + " Trigger = RSI is between " + RSILowTrig + " and 100 and is rising for last " + rsi_UpBars + "  bars", Color.CYAN);
AddChartBubble(BubbleLocation, 28, "RSI" , Color.CYAN);

#====
AddChartBubble(FirstBar && LH_Bubbles, 31.5, "Bollinger Bands(+/- " + Num_Dev_up + " SD)" + " MOmentum Break Out (MOBO(" + MOBO_length + "))." + " Trigger when close goes above upper band and stays bullish until the close goes below the lower band.", Color.WHITE);
AddChartBubble(BubbleLocation, 31.5, "BB MOBO", Color.WHITE);

#========
AddChartBubble(FirstBar && LH_Bubbles, 14, "DMI_Oscillator(" + DMIO_Length + "). Bullish DMI = green = >0: Bearish DMI = red. Trigger = " + DMIO_trig, Color.PINK);
AddChartBubble(BubbleLocation, 14, "DMI_Oscillator" , Color.PINK);

#=======
AddChartBubble(FirstBar && LH_Bubbles, 10.5, "ADX(" + ADX_Length + "). Bullish ADX = green: Bearish ADX = red. Strong bullish ADX trend  is > 25. Trigger = " + ADX_trig, Color.PINK);
AddChartBubble(BubbleLocation, 10.5, "ADX" , Color.PINK);

#======
AddChartBubble(FirstBar && LH_Bubbles, 7, "TrueStrengthIndex(25,13,8,'WMA')." + " Bullish TSI = green & 0 to +50. Bearish TSI = red & 0 to -50.  Trigger = " + TSI_trig, Color.CYAN);
AddChartBubble(BubbleLocation, 7, "TrueStrengthIndex", Color.CYAN);

#=======
AddChartBubble(FirstBar && LH_Bubbles, 50, "RED dot denotes presence of a SQUEEZE", Color.WHITE);
AddChartBubble(BubbleLocation, 50, "Red when Squeeze is 'on'", Color.WHITE);

#=====
AddChartBubble(FirstBar && LH_Bubbles, 3.5, "DynamicMomentumIndex-DYMI(" + DYMI_length + "). Overbought = 70: Oversold  = 30.  Trigger = " + DYMI_trig, Color.CYAN);
AddChartBubble(BubbleLocation, 3.5, " DynMomIndex-DYMI", Color.CYAN);

#=========
#== Labels ==
#Count of Periods in consecutive squeeze
rec count = if isSqueezed then count[1] + 1 else 0;

AddLabel(showlabels, if isSqueezed then "Squeeze is on for " +  count + " bars" else "No Squeeze is on", if isSqueezed then Color.RED else Color.WHITE);
AddLabel(showlabels, "HullMovingAvg(" + Hull_length + ") = " + Round(HullMA, 2), if HullMA > HullMA[1] then Color.GREEN else Color.RED);
AddLabel(showlabels, "MACD.Value(" + MACDValue_2 + ") is above 0 line = " + if MACDValue_2 >= 0 then "true" else "not true", if round(MACDValue_2,1) >= 0 then color.GREEN else color.LIGHT_RED);
AddLabel(showlabels, "MACD.Value(" + macd_Val_1 + ") is above above MACD.Avg(" + macd_Avg1 + ")(signal) = " + if macd_Val_1 > macd_Avg1 then "true" else "not true", if macd_Val_1 > macd_Avg1 then Color.UPTICK else Color.DOWNTICK);
AddLabel(showlabels, if upmobo and  c < Uppermobo then "MOBO close is between(" + Num_Dev_up + " SD) bands"
  else if upmo then "MOBO is above upper(" + Num_Dev_up + " SD) band"
  else if dnmo then "MOBO is below lower(" + Num_Dev_up + " SD) band"
  else "", Color.GREEN);

AddLabel(showlabels, "RSI(" + RSI_length + ") = " + Round(rsi_here, 1), if RSI_trig then Color.GREEN else Color.RED);
AddLabel(showlabels, "Ichimoku(" + tenkan_period + ", " + kijun_period + "):" + "Tenkan / Kijan = " + Ichimoku().Tenkan + " / " + Ichimoku().kijun, if Ichimoku()."Tenkan" > Ichimoku()."Kijun" then Color.GREEN else Color.RED);
AddLabel(showlabels, "MomentumPercent(" + MomPctLength + ") = " + Round(mom_pct, 2) + " %", if mom_pct >= MOM_Pct_trig then Color.GREEN else Color.RED);
AddLabel(showlabels, "Polarized Fractal Eff(" + PFE_length + ") = " + Round(PFE, 0), if PFE >= PFE_trig then Color.GREEN else Color.RED);
AddLabel(showlabels, "DMI Osc(" + DMIO_Length + ") = " + Round(DMI_OSC_here, 1), if DMI_OSC_here >= DMIO_trig then Color.GREEN else Color.RED);
AddLabel(showlabels, "ADX(" + ADX_Length + ") = " + ADX_here, if ADX_here >= ADX_trig && DMI_Pos then Color.GREEN else Color.RED);
AddLabel(showlabels, "TSI = " + Round(TSI_here,1), if TSI_here >= TSI_Trig then color.GREEN else color.RED);
AddLabel(showlabels, "DYMI(" + DYMI_length + ") = " + Round(DYMI_here, 1), if DYMI_here >= DYMI_trig then Color.GREEN else Color.RED);
AddLabel(1,"Use 'Drawings/Pan' to move chart to the left for bubble clarity",color.WHITE);
#== end ==
 of All Code
C-ICHIONEGLANCE STUDY
#IchiOneGlance Version 2.0 by StanL dated 7/19/14
#Hint:This shows, in dashboard format, the main criteria used in the Ichimoku study. It identifies the bullish, neutral and bearish conditions.
#NOTES: The Ichimoku is a very busy study that can be intimidating. However, once understood, it becomes addictive and very useful since it addresses so many different and pertinent aspects. The Ichimoku is also useful for indicating support and resistance levels but this feature is not addressed herein. The Tenkan and Kijun periods, 9 and 26, are NOT recommended to be changed. Scan coding is shown below the respective items.
# USAGE: 'IchiOneGlance' uses up a lot of a chart's real estate and is much more readable when not squeezed; perhaps as an only lower study. One viewing option, when comparing a 'IchiOneGlance' item to a corresponding full TOS chart, is to turn off the price data in 'chart Settings'.
#Usage re Righthand(RH) bubbles. These bubble can be made to expand into empty unused space to look good. To get the RH space select the PAN(upper-finger-pointer) in drawing tools and drag the chart to the left.

declare lower;

plot WhiteLabel = Double.NaN;
WhiteLabel.SetDefaultColor(Color.White);

input tenkan_period = 9;#Hint tenkan_period: The number of bars used to calculate the Tenkan (cyan) plot. Default is 9 and should be retained.
input kijun_period = 26;#Hint kijun_period: The number of bars used to calculate the Kijun (pink) plot. Default is 26 and should be retained.
input ShowLabels = YES;#hint ShowLabels:Toggles labels on/off.
input LH_Bubbles = yes;#hint LH_Bubbles:Toggles left-hand bubbles ON/OFF

def Tenkan_here = Ichimoku(tenkan_period, kijun_period).Tenkan;
def Kijun_here = Ichimoku(tenkan_period, kijun_period).Kijun;

#Define variables used to place a bubble
#========================================
def barNum = BarNumber();
def offset = 0;
def LastBar = !IsNaN(open) and IsNaN(open [-1] ) ;
def BubbleLocation = LastBar[offset];
def FirstBar = if barNum == 1 then 1 else 0;
def FirstBarValue = if barNum == 1 then 1 else 0;
def LastBarValue = if LastBar then barNum else 0;

#example
#addchartbubble(LastBar,45, "This is a last bar bubble", color.White);

#==========================================
#===== Secondary Trend(ST) --- When T > K =======
def Tenkan = Ichimoku(tenkan_period, kijun_period).Tenkan;
def ST_Bull = if Ichimoku(tenkan_period, kijun_period).Tenkan > Ichimoku(tenkan_period, kijun_period).Kijun then 1 else 0;

plot TK_line  = if IsNaN(close) then Double.NaN else 20;
TK_line.SetPaintingStrategy(PaintingStrategy.LINE_VS_SQUARES);
TK_line.SetLineWeight(5);
TK_line.SetDefaultColor(Color.White);
TK_line.AssignValueColor(if ST_Bull then Color.UPTICK else if !ST_Bull then Color.DOWNTICK else color.WHITE);
TK_line.HideBubble();

AddChartBubble(FirstBar && LH_Bubbles, 20, " Ichimoku(" + tenkan_period + "," +  kijun_period + "). Secondary trend when Tenkan > Kijun.", Color.WHITE,yes);
AddChartBubble(BubbleLocation, 20, " Secondary trend" , Color.PINK);

#====== Close is above the cloud (Primary trend = PT)======
def PT_bull = if close > Ichimoku(tenkan_period, kijun_period)."Span A" && close > Ichimoku(tenkan_period,
kijun_period)."Span B" then 1 else 0;
plot PT_line = if IsNaN(close) then Double.NaN else 22;
PT_line.SetPaintingStrategy(PaintingStrategy.LINE_VS_SQUARES);
PT_line.SetLineWeight(5);
PT_line.SetDefaultColor(Color.White);
PT_line.AssignValueColor(if PT_Bull then Color.UPTICK else if IsNaN(open[-1]) then color.WHITE else
color.DOWNTICK);
PT_line.HideBubble();
AddChartBubble(FirstBar && LH_Bubbles, 22, " Ichimoku(" + tenkan_period + "," +  kijun_period + ") Primary trend =
bullish when the close is above the cloud.", Color.WHITE);
AddChartBubble(BubbleLocation, 22, "Primary trend" , Color.PINK);

#=== scan code for 'Close above the cloud' (primary Bullish scan)===
#(close is greater than Ichimoku()."Span A" within 2 bars and close is greater than Ichimoku()."Span B" within 2 bars)
#== end of scan code ==
#== end of primary trend ==

#====== Chikou is above the cloud (Tertiary trend = TT)======
#Def Chikou_here =  Ichimoku(tenkan_period, kijun_period).Chikou;
def Chikou_here = close[26];
def SpanB = Ichimoku(tenkan_period, kijun_period)."Span B";
def SpanA = Ichimoku(tenkan_period, kijun_period)."Span A";
def Chikou_Bull = if Chikou_here > SpanA && Chikou_here > SpanB then 1 else 0;
def TT_Bull = Chikou_Bull;

plot TT_line  = if IsNaN(close) then Double.NaN else 18;
TT_line.SetPaintingStrategy(PaintingStrategy.LINE_VS_SQUARES);
TT_line.SetLineWeight(5);
TT_line.SetDefaultColor(Color.White);
TT_line.AssignValueColor(if TT_Bull  then Color.UPTICK else if !TT_Bull then Color.DOWNTICK else color.blue);
TT_line.AssignValueColor(if Chikou_Bull then color.UPTICK else color.DOWNTICK);
TT_line.HideBubble();

AddChartBubble(FirstBar && LH_Bubbles, 18, " Ichimoku(" + tenkan_period + "," +  kijun_period + ") Tertiary trend = bullish when the Chikou is above the cloud.", Color.WHITE);
AddChartBubble(BubbleLocation, 18, "Tertiary trend", Color.PINK);

#=== scan code for 'Chikou is above the cloud' ===
#Ichimoku()."Chikou" from 26 bars ago is greater than Ichimoku()."Span A" within 2 bars
#=== end of scan code ===
#=== end of Tertiary trend ===

#=========== Presence of powerful 'triple bull' signal ==========
plot Bull_3X  = if IsNaN(close) then Double.NaN else 16;
Bull_3X.SetPaintingStrategy(PaintingStrategy.LINE_VS_SQUARES);
Bull_3X.SetLineWeight(5);
Bull_3X.SetDefaultColor(Color.White);
Bull_3X.HideBubble();

def all3 = if ST_Bull && Chikou_Bull && PT_Bull then 1 else 0;

Bull_3X.AssignValueColor(if All3 then color.UPTICK else color.DOWNTICK);

AddChartBubble(FirstBar && LH_Bubbles, 16, " Ichimoku(" + tenkan_period + "," +  kijun_period + ") Triple bullish trend = bullish Primary, Secondary & Tertiary trends. Best trading opportunity(GREEN).", Color.WHITE,yes);

AddChartBubble(BubbleLocation, 16, "Triple Bull trend" , color.pink);
#==== Scan code for Triple Bullish ====(to use remove '#')
#(close is greater than Ichimoku()."Span A" within 2 bars or close is greater than Ichimoku()."Span B" within 2 bars) and
# Ichimoku()."Tenkan" is greater than Ichimoku().Kijun within 2 bars and
# Ichimoku()."Chikou" from 26 bars ago is greater than Ichimoku()."Span A" within 2 bars
#== end of scan code ==

#=== 'triple bull' signal ===
#======== Neutral(no trend) in-cloud signal ========
plot No_Trend  = if IsNaN(close) then Double.NaN else 14;

No_Trend.SetPaintingStrategy(PaintingStrategy.LINE_VS_SQUARES);
No_Trend.SetLineWeight(5);
No_Trend.SetDefaultColor(Color.White);
No_Trend.HideBubble();

def InCloud = if Between(close, Min(SpanA,SpanB), Max(SpanA,SpanB)) then 1 else 0;
#Def InCloud = if Between(close, SpanA,SpanB) or Between(close, SpanB,SpanA) then 1 else 0;#works but is less clear No_Trend.AssignValueColor(if InCloud then color.Yellow else color.GRAY);
AddChartBubble(FirstBar && LH_Bubbles, 14, " Ichimoku(" + tenkan_period + "," +  kijun_period + ") Neutral(no trend) signal = close is within the cloud. Trading not recommended.", Color.WHITE);
AddChartBubble(BubbleLocation, 14, "Neutral trend(in cloud)" ,color.pink);

#====== strength of bullish secondary(T/K) trend ======
input DeclBarsToUse = 3;#hint DeclBarsToUse:The number of past bars to use to test for declining strength of bullish T/K signal.This triggers the yellow indication when present. Refrain from large values. 1 to 3 is good.

plot Bull_Strength  = if IsNaN(close) then Double.NaN else 12;
Bull_Strength.SetPaintingStrategy(PaintingStrategy.LINE_VS_SQUARES);
Bull_Strength.SetLineWeight(5);
Bull_Strength.SetDefaultColor(Color.White);
Bull_Strength.HideBubble();

Def diff = Ichimoku(tenkan_period, kijun_period).Tenkan - Ichimoku(tenkan_period, kijun_period).Kijun;
def Decline = If ST_Bull && Sum(diff < diff[1],DeclBarsToUse) == DeclBarsToUse then 1 else 0;#Declining difference in the last ? bars of a bullish secondary trend Bull_Strength.AssignValueColor(if decline then color.Yellow else color.GRAY);

AddChartBubble(FirstBar && LH_Bubbles, 12, " Ichimoku(" + tenkan_period + "," +  kijun_period + ") Trigger = Declining Bullish secondary(T>K) trend for last " + DeclBarsToUse + " bars = yellow else gray for no decline.", Color.WHITE);
AddChartBubble(BubbleLocation, 12, "T/K trend strength", color.pink);

#==== Labels ====

#== Line Spacer ===
plot line25 = if IsNaN(close) then Double.NaN else 25;#Used to manage space to set labels above this value.
line25.SetDefaultColor(Color.BLUE);#Insert color to match your background to make line invisible
line25.HideBubble();
#== end ==

AddLabel(Showlabels && !InCloud ,if close > Ichimoku(tenkan_period, kijun_period)."Span A" && close > Ichimoku(tenkan_period, kijun_period)."Span B" then "Bullish 'close is above the cloud'" else "Bearish Primary signal, T is not > K",if close > Ichimoku(tenkan_period, kijun_period)."Span A" && close > Ichimoku(tenkan_period, kijun_period)."Span B" then color.UPTICK else color.Downtick);
AddLabel(Showlabels && !InCloud ,if ST_Bull then "Bullish 'Tenkan > Kijun'" else "Bearish 'Tenkan is less than the Kijun'", if ST_Bull then color.UPTICK else color.DOWNTICK);
AddLabel(Showlabels && !InCloud ,if close > SpanA[26] && close > SpanB[26] then "Bullish 'Chikou is above the cloud' is true" else "Bearish 'Chikou is not above the cloud'", if close > SpanA[26] && close > SpanB[26] then color.UPTICK else color.DOWNTICK);
AddLabel(Showlabels && !InCloud , if ST_Bull && TT_Bull[26] && PT_Bull then "A powerful 3XBullish signal exists" else "A powerful 3XBullish signal does not exists",if ST_Bull && TT_Bull[26] && PT_Bull then color.UPTICK else color.DOWNTICK);
AddLabel(Showlabels && InCloud, "The close is inside the cloud. No trading recommended here. All other labels are suspended. Look for a signal on exiting the cloud.",Color.MAGENTA);
AddLabel(1,"Use 'Drawings/Pan' to move chart to the left for bubble clarity",color.WHITE);
#=== end of IchiOneGlance ===
Watchlist Columns
WLC-PRICE-TO-EARNINGS (P/E) RATIO FOR A WATCHLIST COLUMN
#hint:For a WatchList Column (WLC), shows the price-to-earnings (P/E) ratio. In trader's jargon this tells how expensive a stock's earnings are. Discussions and the literature often relate this to the over-all-market P/E average.

rec AE = if IsNaN(GetActualEarnings()) then 0 else GetActualEarnings();
def EPS_TTM = Sum(AE, 252);#The sum of the trailing twelve months EPS
def PE = close/EPS_TTM ;#The P/E ratio

AddLabel(yes,  round(PE,1));
#end
WLC-WHEN A DIVERGENCE EXISTS BETWEEN PRICE AND THE MACD
#hint:Looks for and indicates positive (price rising) and negative (price declining) divergences of price and the MACD
Input Bars = 3;#Hint Bars:The number of bars in the pattern to evaluate

def mcdv = MACD();
def MACD_rising = sum(mcdv > mcdv[1],bars) == bars;#True if MACD is rising for the last number-of-bars (Bars)
def price_rising = sum(close > close[1],bars) == bars;#True if close is rising for the last number-of-bars (Bars)
def MACD_falling = sum(mcdv < mcdv[1],bars) == bars;#True if MACD is falling for the last number-of-bars (Bars)
def price_falling = sum(close < close[1],bars) == bars;#True if close is falling for the last number-of-bars (Bars)
def pos_div = price_rising && MACD_falling;
def neg_div =  price_falling && MACD_rising;

AddLabel(1, if pos_div  then "pos" else if neg_div then "neg" else "none",  if pos_div == 1 then color.green else if neg_div == 1 then color.red else color.pink );

AssignBackgroundColor(if pos_div then color.dark_green
  else if neg_div then
  color.dark_RED
  else color.current);#Divergence with MACD rising & price falling is RED. The opposite is GREEN. Neither is the normal
  color.

#=====to prove out the code or to use this as a study, plot the below
#   and evaluate that the conditions and results are correct ========
plot Positive = pos_div;# A CYAN value of 'one' plots where true exists
Plot Negative = neg_div;# A PINK value of 'one' plots where true exists
#==================================================================
#end
WLC OF BARS-INTO-A-SQUEEZE
#hint;A WatchList Column (WLC) that shows whether an equity is in a squeeze and if so how many bars it has been in a squeeze. Be sure to set the agg to the chart agg you want to view this on. This is very efficient code.

def Squeeze = if (BollingerBandsSMA()."UpperBand" - KeltnerChannels()."Upper_Band") < 0 then 1 else 0;
def count = compoundvalue(1, If squeeze then count[1] + 1 else if !squeeze then 0 else 0,1);

#addlabel(1, "Bars into a squeeze = " + count, If squeeze then Color.LIGHT_RED else color.Current);
#if column width is a concern the label below shortens the word length and shows the count value

addlabel(1, "SQZ= " + count, If squeeze then Color.LIGHT_RED else color.Current);
# end
Scans
S-LINEAR REGRESSION-VAR SCAN
This is a scan that works well in a dynamic watch list with your favorite companies to trade. It works well as a signal when a company is moving up through resistance in a trough or lower area for a long trade. Vary the "width of channel" and “length” to suit your own preferences.
Plot scan = low crosses LinearRegChVar ("width of channel" = 69, "full range" = no, "length" = 252)."LowerLR"
S-SCAN FOR TRENDING CONDITIONS
input length = 20;#hint length:Number of agg-bars to test for ascending conditions
input bars_up = 5;#hint bars_up:Number of agg-bars being evaluated in <b>sum</b>

def trend_up = IsAscending(close,length);
def trend_up2 = sum(close > close[1],Bars_up) >= Bars_up;

plot scan = trend_up && trend_up2;
Another example
input length = 20;#hint length:Number of agg-bars to test for ascending conditions
input bars = 5;#hint bars:Number of agg-bars being evaluated in <b>sum</b>
def trendup = IsAscending(close,length);
def trendup2 = sum(close > close[1],bars) >= bars;
def mcd = MACD();
def mcdtrend = sum(mcd > mcd[1],bars) == bars;
plot scan = trendup && trendup2 && mcdtrend;
#end
S-SCAN FOR MACD AVG AND MACD DIVERGENCE
Input Bars = 3;#hint bars:The consecutive number of agg-bars being evaluated.
def mcda = MACD().Avg;
def mcdv = MACD();
def div = sum(mcda > mcda[1],Bars) == Bars ;
def div2 = sum(mcdv < mcdv[1],Bars) == Bars;
plot scan = div and div2;
This scan does a good job finding stocks that are tanking!
Plot scan = Crosses( MACD( 12, 26, 9, "SMA" ).Avg, 0, CrossingDirection.Below )
S-SCAN DECLINE FOR ? BARS
input Bars = 5;#hint bars:The consecutive number of agg-bars being evaluated.
plot decline = sum(close < close[1],Bars) ==  Bars;
#end
S-PRICE DIRECTION SCAN
input price = close;
input length = 3;#hint length:Number of consecutive bars being evaluated
input Choice = {default "increased", "decreased"};#hint choice:Choose direction up or down
plot scan;
switch (Choice){
  case "increased":
    scan = sum(price > price[1], length) == length;
  case "decreased":
    scan = sum(price < price[1], length) == length;
}
Comment: When entering the scan, the set aggregation defines the length of a bar. It likely is 'day' but doesn’t have to be. Also, this is a simple clear example of how the 'switch; function operates. Scan for a price increase
input price1 = low;
input percentage = 2.0;#hint percentage: Percent increase in price
input price2 = high;
def x = 1+percentage/100;
def term = x*price2[1];
plot scan = price1 >= term;# The current low is 2% above the previous high
scan.SetpaintingStrategy(paintingStrategy.BOOLEAN_ARROW_DOWN);
#end
S-SCAN FOR HAS-EARNINGS IN FUTURE
Input length = 10;#Hint length:The number of future/ahead agg-bars to evaluate
def earnings = hasearnings();#When true this evaluates to one which then appears in the following 'sum'
plot scan = sum(earnings,length)[-length +1] > 0;
Comment: This could be very useful as a watchlist custom column.
#end
S-SCAN FOR CORRELATED STOCKS
High correlation
input length = 10;#hint length: the agg-bar length being compared
input correlationWithSecurity = "SPX";#hint  correlationWithSecurity; The security that the stock is correlated with
input inarow = 10;#hint inarow:The number of agg-bars in a row with >0.9 correlation

def x = Correlation(close, close(correlationWithSecurity), length) > .9;#greater then 0.9 indicates a high correlation

plot scan = sum(x, inarow) >= inarow;
Low correlation
input length = 10;
input correlationWithSecurity = "SPX";
input inarow = 10;

def x = Correlation(close, close(correlationWithSecurity), length) < =.5;
plot scan = sum(x, inarow) >= inarow;
#end
S-DMI_OSCILLATOR SCAN FOR TRENDING-UP STOCKS
Comment: A good scan for stocks trending up. The aggregation for this is “day”. Change length or the value of 'X > 10' for a more powerful trend. This reads as 'scan for stocks with a DMI_Oscillator value greater than 10 and rising for the last 5 agg-bars.'
def length = 5;# The numbers of agg-bars DMI is climbing
def x =DMI_Oscillator();
def up = x > x[1];

Plot Scan = x > 10 && sum(up,length) >= length;
#end
S-EXAMPLE OF TIME BRACKETED SCAN
Example of Time Bracketed Scan by Mobius
#Time Bracket input Begin = 0930; input End = 1030; def Active = if SecondsFromTime(Begin) > 0 and SecondsTillTime(End) >= 0 then 1 else 0; def Cond1 = if MACD()."Value" crosses above 0 then 1 else 0; plot Signal = Active == 1 and Cond1 == 1;
S-SCAN FOR HIGHS OR LOWS
#hint: scan for stocks with a new 52-week-high # BE SURE to change D to Wk for the filter's aggregation Plot scan = close > highest(high,52)
Alternate 1 = Stocks in top 10 percentile of their 52-week high-low range
#Hint: scan for stocks in the top 10 percentile of their 52-week high-low range # Set aggregation to 'day' input range = 252;#hint range:Number of trading days in a year input price = close; def hi = highest(high,range); def lo = lowest(low,range); def x = (price - lo) / (hi - lo) * 100; plot scan = x > 90;
Alternate 2 = Stocks between 47% and 53% (or the middle of) their 52-week-high-low range
#Hint: scan for stocks between 47% and 53% (or the middle of) their 52-week-high-low range input low_pct = 47; input hi_pct = 53; input range = 252; input price = close; def hi = highest(high,range); def lo = lowest(low,range); def x = (price - lo) / (hi - lo) * 100; plot scan = x <= hi_pct and x >= low_pct;
Alternate 3 = scan to find stocks which made new 20-day-low
input range = 20; plot scan = Low <= Lowest(Low, range) Alternate 4 = scan to find stocks which made new 20-day-high input range = 20; plot scan = High <= Highest(High, range); #end
S-SCAN RSI UNDER 20 & CLOSE > 200-DAY SMA
Alternate 1: Stocks that have a RSI under 20 for 3 days and a closing price above the 200 SMA
Plot scan = (RSIWilder(length = 2) < 20 && RSIWilder(length = 2)[1] < 20 && RSIWilder(length = [2] < 20 && Close > SimpleMovingAvg(length = 200))
Alternate 2: stocks that have a 3-day RSI under 20 a closing price above the 200 SMA
Plot Scan =(RSIWilder(length = 3) < 20 && Close > SimpleMovingAvg(length = 200))
Comment: Set agg to day.
#end
S-SCAN FOR CROSS OF MOVING AVERAGES
Alternate 1: Today’s cross of a 10-bar MA above 20-bar EMA. Set agg = day.
def MA = average(close,10); #10 bar MA def EMA = expaverage(close,20); # 20-Bar EMA def cross = MA[1]<EMA[1] && MA>EMA;
Alternate 2: Cross 3 days back. Set agg = day.
input DaysBack = 3; def MA = average(close,10); #10 bar MA def EMA = expaverage(close,20); # 20-Bar EMA def cross = MA[DaysBack] < EMA[DaysBack] && MA>EMA;
Alternate 3: Plot a dot below the bar that crosses and only that bar.
If you want to see a dot anytime the condition is true, then remove the '&& !cross[1]'
plot Crossing = if cross && !cross[1] then low else double.nan; Crossing.SetPaintingStrategy(PaintingStrategy.points); #end
S-SCAN CROSS OF STANDARD DEVIATION CHANNEL
Scan for price crossing the upper/lower line of the Standard Deviation Channel (SDC).
def _sdcU = StandardDevChannel().UpperLine; plot scanSDC = close >= _sdcU and close[1] < _sdcU[1];
Following the same logic the sdcL would be :
def _sdcL = StandardDevChannel().LowerLine; plot scanSDC = close <= _sdcL and close[1] > _sdcL[1]; #end
S-ABOVE 20-DAY MA FOR 65 DAYS
Scan for stocks above their 20 day MA for 65 days. Set agg = day.
input ConsecutiveClose = 65;#Number of days def avg = Average(close,20);# 20-bar average def above20 = if close >= avg then above20[1] + 1 else 0; plot scan = if above20 >= ConsecutiveClose then 1 else 0;
#end
S-SCAN FOR 200-DAY MA
Alternate 1: A scan that looks for stocks touching the 200-day MA. Set agg = day.
Plot scan = high > average(close,200) && low < average(close,200)
Alternate 2: Price crosses the 200-day MA
def SMA = SimpleMovingAvg( close, 200, 0 ); plot SmaScan = crosses( close, SMA, CrossingDirection.Any );
Alternate 3: For a better study for the scan, use this. You’ll get more hits. This one doesn’t care if the close is above the 200-day MA as long as EITHER the close is above the 200-day MA OR the 200-day MA is bracketed. Same for the reverse case.
def avg = Average(close, 200); def Bracketing = high > average(close,200) && low < average(close,200); def above200 = if close >= avg or Bracketing then above200[1] + 1 else 0; Plot scan = above200;
OR
def below200 = if close<=avg or Bracketing then below200[1] + 1 else 0; Plot scan = below200;
#end
S-SCAN FOR A BULLISH ADX
-
Comment: Use the DMI along with the ADX. The ADX can be bullish or bearish depending on whether the DMIplus is greater than the DMIminus.
ADX()."ADX" > 40 && DIPlus()."DI+" > DIMinus()."DI-"
#end
S-SCAN FOR DMI
Comment: Use the DMI along with the ADX. The ADX can be bullish or bearish depending on whether the DMIplus is greater than the DMIminus.
Alternate 1: DMI+ crosses above DMI-
def DMIplus = DMI(length = 25)."DI+"; def DMIminus = DMI(length = 25)."DI-"; plot Scan = DMIplus > DMIminus and DMIplus[1] <= DMIminus[1];
Alternate 2: DMI+ is above DMI-
def DMIplus = DMI(length = 25)."DI+"; def DMIminus = DMI(length = 25)."DI-"; plot Scan = DMIplus > DMIminus;
Alternate 2: DMI+ crosses below DMI-
def DMIplus = DMI(length = 25)."DI+"; def DMIminus = DMI(length = 25)."DI-"; plot Scan = DMIplus < DMIminus and DMIplus[1] >= DMIminus[1];
Alternate 2: DMI+ is below the DMI-
def DMIplus = DMI(length = 25)."DI+"; def DMIminus = DMI(length = 25)."DI-"; plot Scan = DMIplus < DMIminus;
#end
S-SCAN USING PRE-DEFINED CROSSOVERS
Scan for the MACD Histogram value crossing from positive to negative or vice versa. Uses MACDHistogram Crossover default parameters of fastLength = 12, slowLength = 26, MACDLength = 9, AverageType = EMA
input crossingType = {default "Positive to Negative", "Negative to Positive"};
def MACD_cross_above = MACDHistogramCrossover(crossingType == "Negative to Positive").signal;
plot scan = MACD_cross_above;
OR
def MACD_cross_below = MACDHistogramCrossover(crossingType == "Positive to Negative").signal; plot scan = MACD_cross_below;
ADXCrossover: Scan for the ADX (bullish or bearish) crossing a specified level (threshold). The default parameters are length = 14, threshold = 20. When the DMIplus is greater than the DMIminus the ADX is 'Bullish' or vice versa is 'Bearish'.
input crossingType = {default above, below};
Plot ADX_Bull = ADXCrossover(crossingType = "above") .signal && DMI."DI+" > DMI."DI-";
OR
Plot ADX_Bear = ADXCrossover(crossingType = "above") .signal && DMI."DI-" > DMI."DI+";
#MomentumCrossover: Scans for the Momentum crosses the zero line. The default length = 12;
input crossingType = {default "Positive to Negative", "Negative to Positive"};
plot RisingMomentum = MomentumCrossover(crossingType == CrossingType."Negative to Positive").signal;
OR
plot FallingMomentum = MomentumCrossover(crossingType == CrossingType."Positive to Negative").signal;
MoneyFlowIndexCrossover: Scans for the Money Flow Index crossing the specified level. The default parameters are
length = 14, threshold = 20.
input crossingType = {default above, below};
Plot MFI_above = MoneyFlowIndexCrossover(crossingType == crossingType.above).signal;
-
OR
Plot MFI_below = MoneyFlowIndexCrossover(crossingType == crossingType.below).signal;
MovingAvgCrossover: Scans for crossovers of moving averages of different types and lengths. The defaults parameters are price = close, length1 = 15, length2 = 30. This example will specify all parameters to avoid confusion.
input averageType1 = {default Simple, Exponential, Weighted, Wilders, Hull};
input averageType2 = {default Simple, Exponential, Weighted, Wilders, Hull};
input crossingType = {default above, below};
Plot MA_above = MovingAvgCrossover(price = close, Length1 = 15, length2 = 30, averageType1 = "simple",averageType2 = "Exponential", crossingType = "above").signal;
The above reads as a’based on the close, simple average1 of length = 15 crosses above exponential average2 of length = 30.'
OR
Plot MA_below = MovingAvgCrossover(price = close, Length1 = 15, length2 = 30, averageType1 = "simple",averageType2 = "Exponential", crossingType = "below").signal;
The above reads as a’based on the close, simple average1 of length = 15 crosses below exponential average2 of length = 30.'
ParabolicSARCrossover: Scans for the Parabolic SAR crossing the price plot close. The defaults are accelerationFactor = 0.02, accelerationLimit = 0.2
input crossingType = {default Bearish, Bullish};
Plot SAR_Bear = ParabolicSARCrossover(crossingType = "Bearish").signal;
OR
Plot SAR_Bull = ParabolicSARCrossover(crossingType = "Bullish").signal;
PriceAverageCrossover: The Price Average Crossover scans for crossovers of price with its moving average. The default parameters are price = close, length = 15
input averageType = {default Simple, Exponential, Weighted, Wilders, Hull};
input crossingType = {default above, below};
Plot PAC_above = PriceAverageCrossover( averageType = "Exponential", crossingType = "above").signal;
The above reads 'scan for when the 15 bar exponential moving average crosses above the close'.
OR
Plot PAC_below = PriceAverageCrossover( averageType = "Exponential", crossingType = "below").signal;
The above reads 'scan for when the 15 bar exponential moving average crosses below the close'.
RSIWilderCrossover: The RSI Wilder Crossover scans for an overbought-oversold indicator of specified levels. The defaults are length = 14, threshold = 30. Specify the threshold for the overbought-oversold value desired
input crossingType = {default above, below};
Plot RSI_Cross_Above = RSIWilderCrossover(threshold = 30, crossingType = "above").signal;
The above reads 'scan for when the RSI Wilder crosses above 30'.
OR
Plot RSI_Cross_Below = RSIWilderCrossover(threshold = 30, crossingType = "Below").signal;
The above reads 'scan for when the RSI Wilder crosses below 30'.
RateOfChangeCrossover: The Rate Of Change Crossover for where Rate Of Change crosses zero level. The default is length = 14.
input crossingType = {default "Positive to Negative", "Negative to Positive"};
plot ROC_Neg = RateOfChangeCrossover( crossingType = "Positive to Negative").signal;
The above reads as 'scan for when the rate of change crosses below zero (or goes negative).'
OR
plot ROC_Pos = RateOfChangeCrossover( crossingType = "Negative to Positive").signal;
The above reads as 'scan for when the rate of change crosses above zero (or goes positive).'
StochasticCrossover: The Stochastic Crossover for when the Stochastic Slow or Stochastic Fast crosses overbought (80%) or oversold (20%) level. The default parameters are KPeriod = 14. Note the overbought and oversold levels are predefine as 80/20 respectively and can’t be changed when using this crossover study.
input stochasticMode = {default StochasticFast, StochasticSlow};
input crossingType = {default Overbought, Oversold};
Plot Stoch_Fast_OB = StochasticCrossover(stochasticMode = "StochasticFast", crossingType = "Overbought").signal;
The above reads as 'scan for when the 14 period fast stochastic crosses above 80'.
OR
Plot Stoch_Slow_OS = StochasticCrossover(stochasticMode = "StochasticSlow", crossingType = "Oversold").signal;
The above reads as 'scan for when the 14 period slow stochastic crosses below 20'.
Comment1: Re all crossover scans, refer to "Referencing other studies" for a complete explanation of the applicable rules for specifying parameters
Comment2: The examples shown above do not represent all possible combinations of the parameters available. Using the examples guides you re what parameters are applicable and how you may change them to suit your desires.
Comment3: Each of the 11 crossover scans are selectable in the Scan/StockHacker tab. This is a very easy way toimplement these scans since all the parameters are presented for easy assgnment.
#end
S-MACD SCAN
Bullish Scan: The MACD value crosses above the MACD average while both are below zero
def MACD_Val = MACD(12,26,9).Value; def MACD_Avg = MACD(12,26,9).Avg; def xOver = MACD_Val [1] < MACD_Avg [1] and MACD_Val >= MACD_Avg ; plot bullishScan = xOver and MACD_Val < 0 and MACD_Avg < 0; Bearish scan: The MACD value crosses above the MACD average while both are Above zero def MACD_Val = MACD(12,26,9).Value; def MACD_Avg = MACD(12,26,9).Avg; def xOver = MACD_Val [1] < MACD_Avg [1] and MACD_Val >= MACD_Avg ; plot bearishScan = xOver and MACD_Val > 0 and MACD_Avg > 0;
Scanning for stocks that have just crossed over produces less hits that a scan that looks for a xOver within one (1) day.
def MACD_Val = MACD(12,26,9).Value; def MACD_Avg = MACD(12,26,9).Avg; def xOver = MACD_Val[1] < MACD_Avg[1] and MACD_Val >= MACD_Avg; plot bearishScan = ( xOver or xOver[1] ) and MACD_Val > 0 and MACD_Avg > 0;
Suggest: To get a meaningful scan use: 1) fundamental filter: close >=10, and 2) study filter: VolumeAvg(50) >= 500000
#end
S-NEW 52 WEEK HIGHS IN THE PAST ? DAYS
Scan for equities that have made new 52 week highs in the past 5 days.
input lookback = 5; # past N days def hhy = Highest( high, 252 ); plot h = Highest( high, lookback ) == hhy;
#end
S-SCAN PRICE CORRELATION WITH THE SPX
This is a price correlation scan compared to the SPX with a correlation of 0.95 to 1.0 for the last 50 bars. Below is the picture of the StockHacker composition. Use a 'day' aggregation:
Alternate:
#hint:High correlation scan. By Mr Script input length = 10;#hint length: the agg-bar length being compared input correlationWithSecurity = "SPX";#hint correlationWithSecurity; The security that the stock is correlated with input inarow = 10;#hint inarow:The number of agg-bars in a row with >0.9 correlation def x = Correlation(close, close(correlationWithSecurity), length) > .9;#greater then 0.9 indicates a high correlation plot scan = sum(x, inarow) >= inarow;
#end
S- INCREASING EARNINGS SCAN
Comment 1: By Nick Name @ ThinkScript Lounge: Someone asked me about an increasing earnings scan for 2 quarters. This will do it. I’ve written extensive notes for the curious to explain how it works, how and why the statements are built the way they are. If you want to see it just make it a lower study. Comment 2: The annotation is excellent for learning ThinkScript. You don’t see this often because doing it is very time consuming and coders are more forcused on results in lieu of explanations.
#Increasing Earnings Scan #v2.28.14.1 #Scan for earnings > previous quarter earnings #times_up input determines the number of times earnings increased #Example: times_up = 4, scan checks for earnings increasing at least 4 quarters in a row #default = 2 since 2 was the requested number #extensive notes are provided for the curious input times_up = 2; #define a variable for GetActualEarnings() for efficiency def gae = GetActualEarnings(); #Description of recs are written in plain English, followed by the corresponding script use # We need to get the earnings value and carry it forward so we can compare the next earnings to it #if earnings are reported: if(!isNaN(gae), #then get the earnings number: gae, #else keep the last earnings number: earn[1]); rec ern = if(!isNaN(gae), gae, ern[1]); #if there are never any earnings this will always = Double.NaN #Now to determine if earnings are increasing enough times in a row we need to count every time they increase. If earnings are < prior quarter, we'll reset the count to 0. #CompoundValue is used to make sure the count initializes with a number: 0 in this case. If it starts with Double.NaN, it may not work. #start this on the first bar: (CompoundValue(1, #if earnings are reported: if(!isNaN(gae), #then if earnings are greater than the prior earnings value: if(ern > ern[1], #count it by adding 1 to the previous count: ern_up[1] + 1, #else set the count to 0: 0), #else (if earnings aren't reported) keep the previous count value: ern_up[1]), #intialize the value of the variable to 0: 0); rec ern_up = CompoundValue(1, if(!isNaN(gae), if(ern > ern[1], ern_up[1] + 1, 0), ern_up[1]), 0); #plot the result of ern_up >= times_up #if you plot this in a study it will plot 1 (true, earnings have increased at least a number of quarters = to times_up input) or 0 (false, they haven't increased that many times) plot scan = ern_up >= times_up; #If you wanted to scan for earnings increasing only x number of times and not more, change >= to == . e.g. with times_up == 2, using >= means earnings increasing 4 times in a row meet the criteria. #end
S-SCAN FOR TOS' STRENGTH METER
Comment: TOS has a column heading titled 'Strength Meter' which reads "stocks that have risen 10% in the last three weeks will have their strength meter activated. The green sloped bar in the watchlist column wil then be activated. The code is presented here so you may change it to your liking. For example, you may want this to show based on 2 weeks in lieu of 3 weeks. The reverse is also true when a down-sloped RED bar shows.This is the picture of the subject:
declare lower;
def Agg = AggregationPeriod.Week;
plot Data = close(period = agg) / close(period = agg)[3];
Data.SetPaintingStrategy(PaintingStrategy.Histogram);
Data.AssignValueColor(if Data > 1.1
then Color.Green
else if Data < .9
then Color.Red
else Color.Yellow);
Data.SetLineWeight(3);
========= scan code =========#end
S-NOTEWORTHY RESOURCE FOR PREDEFINED SCANS
Although TOS provides many powerful features, there are also other very useful resources on the Net. Here is a free one at a premier charting sites, Stock Charts, Check this out for Predefined Scans. Granted using this does not allow you to easily put stocks into a TOS watchlist but, nonetheless, this is very useful data.
Realize that the data-feed for Stock Charts may not be the same as that for TOS but that should not likely cause any conflicts because the source of all data is the exchanges. Visit the site
S-MOVING AVERAGE COMPARISON
#Scan for MA compared to MA ? agg-bars ago
input length = 10;#hint length: The length of the moving average
input LookBack = 2;#hint LookBack: The agg-bars back moving average being compared to
Plot scan = Average(close, length) > Average(close, length)[LookBack]);
# The above reads as SimpleMovingAvg("length" = 10) is greater than SimpleMovingAvg("length" = 10) from 2 agg-bars ago.If aggregation is 'week' then 'agg-bars ago' is 2 weeks ago. If aggregation is set to 'Day' then 'agg-bars ago' is 2 days go
S-NEW BULLISH CLOSE ABOVE THE ICHIMONU CLOUD
new bullish close above the cloud
close crosses above Ichimoku()."Span A" within 5 bars and
Ichimoku()."Span A" is greater than Ichimoku()."Span B" and
Ichimoku()."Tenkan" is greater than or equal to Ichimoku()."Kijun"S-CROSSING ABOVE & BELOW THE ICHIMOKU CLOUD
Ichimoku scan for crossing above the cloud
close crosses above Max(Ichimoku()."Span A", Ichimoku()."Span B")
Ichimoku scan for crossing below the cloud
close crosses below Min(Ichimoku()."Span A", Ichimoku()."Span B")
Tutorials (How-To-Do’s)
Alert Sounds
Usage Tips
T-USING CUSTOM COLUMN AGGREGATION
Here’s an interesting concept/tip that you may find very useful and it’s not obvious. The '%HL Custom Column' (available at http://mytrade.com/StanL ) tells where, in today’s prices, a stock is now i.e. 35% means it is now at 35% of today’s range (low to high). 100% means it is at its high of today’s range. These numbers are based on the columns "day" aggregation. That agg can be changed to say '4 days'. The column will then tell where in the range of the last 4 days, the stock currently is. Use a month agg and it will tell where in the last month’s range the stock currently is. The same concept applies to all aggs. Isn’t that neat? And it is so easy to change the agg. Also custom columns have some aggs that are different from the normal chart aggs. For example 4-days is a column agg choice but is not a choice of the chart settings (the agg dropdown).
The example used here, %HL, is a custom column study available at http://mytrade.com/StanL Of course, you will need to keep track of what agg you are currently using. Perhaps you can do that with the title of the custom column. After installing the %HL you access editing it by right-clicking the watchlist column headings to customize and follow the snapshots below:
<a name="HOW_TO_DECIPHER_COMPLEX_STUDY_PLOTS"> </a> === T-HOW TO DECIPHER COMPLEX STUDY PLOTS
There are some studies that have numerous plots. Deciphering what plot corresponds to particular code can be a challenge. Here is a tricky way to do it.
Here is the situation in a Edit Studies example.
In this example, if you want to identify what plot is the ORH, you uncheck 'Show Plot' and the click 'Apply'. While doing this you can observe which plot is ORH because it disappears. This can be reversed and redone if you missed the observation.This works on any highlighted plot. You can also use color changes to identify various plots.
-
#end
T-A REFERENCE RECALL OF A STRATEGY’S RULES (SETUP)
A 'setup' is a term/title applied to a group of charts and indicators that are used to implement a trading strategy. For example, there is a 9/30 setup that is openly discussed on the internet. Also an esteemed TS coder has written the '3X oscillator' for use specifically with the 9/30 setup.
Setups frequently have rules re what needs to exist to implement its buy/sell strategy. Such rules may be simple or complex but, regardless, are not easy to remember. This tip is to use TOS 'ThinkLog' to store those rules for easy reference. ThinkLog is accessed via the 'Tools/ThinkLog' tab and is a ready reference place where you could refresh you memory on the implementation details of the 9/30 strategy’s particulars.
T-FAST ACCESS TO EDITING A STUDY
The fastest way to edit a study is to double click on the plot on the chart. However, at times, clicking the right location can take many tries. This is where study highlighting can come in handy for finding the right place and time to double-click. Here is where highlighting hoovering is set:
T-A NEW-TO-THINKSCRIPT MUST READ
TOS has many valuable resources that may, for some, be hard to keep track of. This is a reminder of an especially valuable resource for new learners of ThinkScript as well as a refresher for you 'pros' out there. The Learning Center’s 'charting/ThinkScript' ( Click here to see it ) is a must read for all newcomers to ThinkScript. Although this has three sections the 'ThinkScript Tutorials' are especially pertinent.
T-USING MULTIPLE TIME FRAMES TO PLAN ENTRIES
Using multiple time frames to plan entries is smart ( See Article ). To facilitate implementing a multiple-time-frame approach consider establishing a named grid with each grid component having the charts and indicators at the time frames that you are interested in. You can navigate from one grid-box to another with a single click of the grid navigation buttons. Giving the grid a name allows you to call it up whenever you want. A 'flexible grid' would be ideal for such a purpose.
T-WIZARD ACCESS FOR EDITING EXISTING STUDIES
When editing existing studies and you want to use the wizard, you have two choices: 1. Open a new study. Copy the wizard result via CTRL-C and then 'CANCEL' the new study; or 2. Use the wizard in the 'scan/stock hacker' and copy the wizard result via CTRL-C for pasting into the existing study editing.
T-PRE MARKET MOVERS
Pre market scans are not very efficient. TOS provides a good source for pre-market movers that is accessed in the left panel by: (1) Click the + at the bottom of the left panel; (2) click 'Use The News'; and (3) Select Pre-Market Movers.
Note that the columns can be customized and adding a 'Send to [4] Green', for example, gives a quick chart of the stock.
T- VERTICAL LINES AT MARKET OPEN AND CLOSED TIMES
Granted that not all personal preferences are the same. I find that frequently changing the timeframe of charts is much easier to read when I have vertical lines as market start and end times. The following code will establish those markers.
The end-time markers may seem redundant and they are if you do not 'Show Extended Session' or 'Expansion Area' for stocks. Futures and Forex are a different story.
#hint:Places vertical lines at start and end times
#TOS title = VertLines_at_START_END_times
input time1 = 930;
input time2 = 1630;
def StartTime = SecondsFromTime(time1) ==0;
def EndTime = SecondsFromTime(time2) ==0;
AddVerticalLine(StartTime,"Market Open",Color.RED,Curve.SHORT_DASH);
AddVerticalLine(EndTime," Market Closed",Color.RED,Curve.SHORT_DASH);T-EASILY VIEWING CHARTS OF STOCKS IN A LIST
Comment: You have a watchlist in either the left-hand panel or in 'Market Watch/Quotes'. Wouldn’t it be nice to move thru the list looking at a chart for any stock that you want. This technique is too neat not to call it to your attention herein. Here is how it’s done. In the left panel:
To set the color 'Send To' buttons:
In the left panel In the Market Watch/Quotes In the Market Watch/Quotes
The procedure for charting the stock is different in the two locations:
-
In the left panel, highlighting the stock will chart it:
-
In 'Market Watch/ Quotes', clicking on the 'Send To' button (in this case the green square) will chart the stock.
#end
T-CHANGING THE HEADER TEXT COLOR
The header text color is set to the first color definition found in the code.
Occasionally this color is hard to read if it is close to your screens background color. The following code, placed as the top lines in your study, will reset the header text color and affect nothing else except a shown below in 'edit studies'.
plot WhiteLabel = Double.NaN;
WhiteLabel.SetDefaultColor(Color.WHITE);#Use any color you desireThe above will now look like:
Note that the LinearRegCh100 color cannot be changed because it is a built-in study and its code is non-editable.
However, there are unintended consequences as shown below in this 'edit studies' screen.
#end
T-SEQUENCECOUNTER AND GRID UASGE
The use of the TOS 'SequenceCounter', for intra-day trading, has an advantage when the count can be viewed to multiple aggregations simultaneously. This can be done by setting up a grid of 4 components, as an example. The below picture illustrates doing this. Also configure the chart to synchronize the cursor across all grid charts via Chart settings/general tab/Synchronize crosshair position. A tick chart seems to present a neat plot. Regular grids is suggested in lieu of flexible grids. A picture of the setup is shown below:
Comment: The Sequence Counter is used as an example and is not a recommended indicator: reviews are not in unison.
#end
T-ENHANCE THE LOOKS OF A HISTOGRAM PLOT
To enhance the looks of a histogram, plot the same histogram data as a line and format that line as follows. Before and after pics are shown.
plot Histogram_Liner = Same data as for the histogram plot
Histogram_Liner.SetPaintingStrategy(PaintingStrategy.LINE);
Histogram_Liner.SetLineWeight(1);
Histogram_Liner.SetDefaultColor(Color.CYAN);T-PRIVACY TO NOT SHOW ACCOUNT DOLLARS
To activate privacy that shows * instead of the dollar values, click the blue dot left of the 'Net Liq & Day Trades' and check the privacy square.
T-NAVIGATION VIA KEYBOARD HOTKEYS vs THE MOUSE
When doing a lot of coding, using the mouse provides fast traveling to various locations in the code. However, there are keyboard hotkeys that facilitate editing activities. Below is a useful list of those available in Win 7, the TS editor and most editing programs. Some are especially useful at selecting text by letter, word, line, paragraph, window, etc. Try them out and you may adopt them as your standard way of editing in combination with using the mouse.
Ctrl+C (or Ctrl+Insert)
Copy the selected item
Ctrl+X
Cut the selected item. Item cut becomes available for pasting.
Ctrl+V (or Shift+Insert)
Paste the selected item
-
Ctrl+Z
-
Ctrl+Y
Undo a previous action
Redo a previous action
-
Delete (or Ctrl+D)
Delete the selected item and move it to the Recycle Bin
-
Shift+Delete
Delete the selected item without moving it to the Recycle Bin first
-
Ctrl+Right Arrow
Move the cursor to the beginning of the next word
-
Ctrl+Left Arrow
Move the cursor to the beginning of the previous word
-
Ctrl+Down Arrow
Move the cursor to the beginning of the next paragraph
-
Ctrl+Up Arrow
Move the cursor to the beginning of the previous paragraph
-
Ctrl+Shift with an arrow key
Select a block of text
-
Shift with any arrow key
Select more than one item in a window or on the desktop, or select text within adocument
-
Ctrl with any arrow
-
key+Spacebar
Select multiple individual items in a window or on the desktop
-
Ctrl+A
Select all items in a document or window
-
Ctrl+Shift+Esc
Open Task Manager
-
Right Arrow
-
Left Arrow
-
Others
Open the next menu to the right, or open a submenu
Open the next menu to the left, or close a submenu
There may be other hotkeys of interest to you at Go Here
-
The free 'Notepad++' is an excellent editor made specifically for coding: http://notepad-plus-plus.org/
-
#end
T-THE DREADED 'TOO COMPLEX ERROR'
Custom columns run in "TOS real-time". Additionally they have CPU performance limits (which is on their servers where all scripts run), so if your script has too much "stuff" in it and is pre-analyzed to take more execution time than is allowed you get the dreaded "too complex error."
The solution is to pare the script down to its essence and apply some good ole brain power to the data. Say you have two plots (which always generates an error in custom columns, scans, and conditional orders) and seven to eight conditions shown as nine colors packed into a single column. How did you expect to display two numerical results in each single cell?
Not to mention the rainbow of colors. Not every script that works on a chart/study is worthy of putting in a custom column.
Long series of 'if conditions' also can create the 'too complex error'. You may be able to eliminate the error if you break up a long series of if-conditions into simple sub-conditions and then combine the sub-conditions into an overall 'If' statement. Another example that you may try as a work-around is as follows:
Cond1 = if Low[1] <= Lowest(low, 10) then 1 else 0;
Cond2 = if close > High[1] or low[2] <=lowest(low,10) then 1 else 0;
Cond3 = if close > high[2] or Low[3] <= Lowest(low, 10) then 1 else 0;
Cond4 = if close > High[3] or low[4] <= lowest(low,10) then 1 else 0;
Cond5 = if close > high[4] or low[5] <= lowest(low,10) then 1 else 0;
Cond6 = if close > high[5] then 1 else 0;
#Plot if Sum(cond1,cond2,cond3, cond4, cond5, cond6) = 6 then ? else ?;Realize also that overly complex if-conditions are only one aspect that generates the 'too complex' error. As initially said, it could be superfluous lines in your code retained when converting a study into a custom column. For example, 'PlotName.SetPaintingStrategy(PaintingStrategy.LINE);' and 'PlotName.SetLineWeight(1);' are superfluous in a custom column but contribute to TOS' evaluation of the 'too complex error'. Remember that we are not privy to what TOS uses to evaluates the 'too complex error' but you can be sure that the presence of superfluous code lines contribute to the error. In summary, make your code compact and smart with only necessary essential lines.
T-DEFINING AND APPLYING CONDITIONS IN A STUDY
When developing a strategy or adding buy/sell arrows to a chart, it is normal to have many conditions that you are considering. When you have multiple conditions, at times it is difficult to know what conditions are firing and when. This tip presents a method to sort out the confusion that may arise with multiple conditions. The below picture is used to illustrate the concept.
The concept is to define each of your conditions in the format of '1 when true' and '0 when false'. Then plot each condition. Below you see 5 conditions and plots showing when each condition is true or false ( 1 or 0). Placing the cursor over an arrow, you can see what conditions are firing (are 1, true) to produce that arrow. Conversely, if arrows are not desired at a particular location, you then will see what condition to change. The reverse is also true when desired arrows do not exist because a condition is not being triggered.
How to do this? You take your basic code study…the one that plotted the arrows, and change the 'plot' statements to 'def' statements. You change the condition-def statements to plot statements. You create a new study for each condition so it will be plotted or you may combine condition plots in a study if you are able to identify one condition from another by colors or type of plot. Also labels are valuable for clarifications.
Don’t forget to delete the studies, 5 in this example, that plotted the cnditions to preclude accumulation of studies that have no further use.
T-NAMING COPIED BUILTIN STUDIES
There are many instances when the built-in studies are copied and reused so you may add your own features be they technical or just look-and-feel coloring. When doing so, it is suggested that you name the new study as follows:
Builtin-name + _ + your-initials. So the MACD will look like 'MACD_ME'. The benefit of doing this is that the builtin and your modified copy stay adjacent in the list and it helps you to keep track of what you may have done two months ago.
T-'PERCENTAGE VIEW' ON PRICE CHARTS
This feature enables you to view price as percentage values in lieu of dollars. This is useful when assessing price changes and comparisons. For example, the percentage of a price gap can be read by setting the initial price value to 0% and reading the gap-% value at the other end of the gap. Similarly, percent differences can be read between any two bars on the chart.
There are two modes for setting the 0% location:
-
The first bar of the chart is set to 0% as the default.
-
Any bar may then be set to the 0%
'Percentage view' may be initiated in three ways:
-
By going to 'chart settings/price axis' tab and checking the boxes per the picture below
-
Clicking the 'finger up pointer' as shown below:
-
Clicking 'style' then 'Chart Scale' to bring up the same menu as above.
Setting any bar of the chart to 0%:
While 'percentage view' is activated, place the cursor-line over the desired bar and right click.
In the menu presented, select 'Set bar as 0%'. A horizontal 0% line will appear accross the chart at the value of the selected bar’s close.
To reset the chart to the original first bar’s close, right click on the zero percent level line and choose 'Reset to default 0% level'.
The calculation for the percentage shown is: (current price – close price of 0%-selected-bar) / close price of 0%-selected-bar * 100.
#end
T-CHANGING RIGHT EXPANSION AREA SETTING
There are three ways to do this. The easiest will be listed first.
-
Using the 'pan' tool Go to 'Drawings' and select the 'Pan' tool . This icon will now show on the chart in lieu of the cursor. Simply hold- down the left mouse key and drag the chart to the left for as much right-space as you want. Return to 'drawings' and select 'pointer' to re-establish it. The space you panned for will be recorded in 'Chart settings/time axis/expansion area'.
-
Using the chart’s lower-right symbol Click the symbol and this menu will appear: Clicking as shown will take you to 'Chart settings/time axis' where you set the’expansion bars to the right'.
-
Using the chart settings directly Clicking as shown will take you to 'Chart settings/time axis' where you set the’expansion bars to the right'.
T-RENAMING STUDIES CAUTION
Re the recent release & Renaming studies. This feature is worthy of explanation/clarification:
If you use a study on say 15 different charts. Renaming a study will automatically change the study to the new name on each of the 15 charts. However, there are a number of places in TOS like Study Filters, Study Alerts, Custom Quotes, and Conditional orders that are allowed to use referenced studies. If the renamed study is referenced therein with the old name, then that reference(old name) will be broken i.e. will no longer work and will not be changed to the new study name. Dynamic scans are particularly vulnerable and will become ineffective if a custom referenced study is renamed.